Welcome to College Transitions’ first look at the overall Ivy League acceptance rates as well as acceptance rates at other highly-selective colleges and universities for the 2022-23 cycle. As of this posting in April of 2023, there are still many schools who have yet to report their initial results. As such, you will see a number of “TBD” designations in the charts below. These will be updated as soon as additional data becomes available.
For ED/REA Acceptance Rates Visit our blog from earlier in the year entitled: Class of 2027 – Ivy League & Elite College Early Decision Acceptance Rates.
What follows are two charts, both showing Class of 2027 and Class of 2026 data. One is for Ivy League schools and the other is for additional elite schools who are known for reporting their preliminary admissions information in a timely manner. We will also highlight trends and notable facts from schools that have reported their present-year acceptance rates.
Ivy League Acceptance Rates
| School Name | # of Applicants for Class of 2027 | # of Applicants Accepted into Class of 2027 | Acceptance Rate for Class of 2027 | Acceptance Rate for Class of 2026 |
| Brown | 51,302 | 2,609 | 5.1% | 5.0% |
| Columbia | 57,129 | 2,246 | 3.9% | 3.7% |
| Cornell | TBD | TBD | Not Released | 7.3% |
| Dartmouth | 28,841 | 1,798 | 6.2% | 6.2% |
| Harvard | 56,937 | 1,942 | 3.4% | 3.2% |
| Penn | TBD | TBD | Not Released | 6.5% |
| Princeton | TBD | TBD | Not Released | TBD |
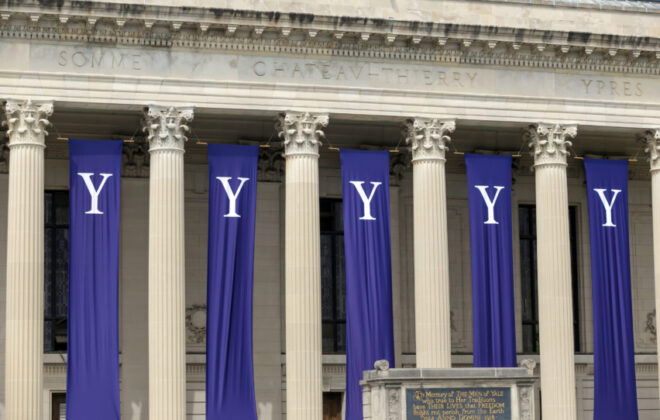
| Yale | 52,250 | 2,275 | 4.4% | 4.4% |
Ivy League Acceptance Rates – Facts & Trends:
Brown
- Students in the admitted Class of 2027 hail from all 50 U.S. states, plus Washington D.C., Guam, Puerto Rico and the Virgin Islands. They come from 90 countries across the globe.
- The University saw an increase in the number of applicants who will be the first person in their families to attend college, as well as a surge in the number from low- and moderate-income families.
- Amid the largest applicant pool to date, there was an 8% increase in the number of applicants from Rhode Island, a 3% growth in students from rural areas and small towns, and the largest admitted group of student veterans to date
Columbia
- This year, newly admitted students come from all 50 states, numerous US territories, and 101 countries.
- Around half of the admitted students were offered need-based financial aid.
- 57,129 applications is the third largest applicant pool in Columbia’s history.
Dartmouth
- The 28,841 applications comprise the largest pool in Dartmouth’s 253-year history, representing a 2% increase over last year.
- It is the third consecutive year in which the College’s acceptance rate is 6%.19% of admitted students living within the U.S. qualify for Pell Grants.
- $51 million have been offered to accepted students, with an average scholarship of $65,411.
Harvard
- This year saw a 7 percent decrease in the total number of applications from last year’s all-time high of 61,220 applicants.
- African American or Black students comprise 15.3 percent of applicants admitted to the Class of 2027.
- Students admitted to the Class of 2027 come from all 50 states and 102 countries.
Yale
- The target size for the first-year class has rested between 1,550 and 1,575 students since the new residential colleges — Pauli Murray and Benjamin Franklin Colleges — opened in 2017.
- Newly-admitted students who choose to join the class of 2027 will be joined by an additional 54 students who were originally admitted to the class of 2026.
- The number of applicants is up by nearly 50 percent compared to the pool of students that sought entry to the class of 2024.
Other Highly-Selective Colleges Overall 2023 Acceptance Rates
| School Name | # of Applicants for Class of 2027 | # of Applicants Accepted into Class of 2027 | Acceptance Rate for Class of 2027 | Acceptance Rate for Class of 2026 |
| Amherst | 12,700 | ~1,140 | 9% | 7.3% |
| Duke | 49,469 | 2,948 | 6% | 6.2% |
| Emory | 33,534 | 5,445 | 16.2% | 15.8% |
| Georgetown | 25,519 | 3,263 | 13% | 12.1% |
| MIT | 26,914 | 1,259 | 4.7% | 4% |
| NYU | 120,000+ | N/A | 8% | 12.2% |
| Northwestern | 52,000+ | N/A | ~7% | 7% |
| Rice | 31,049 | 2,399 | 7.7% | 8.6% |
| Swarthmore | 14,287 | 969 | 6.7% | 6.9% |
| Tufts | 34,000+ | TDB | 9.5% | 9.7% |
| USC | 80,790 | 8,032 | 9.9% | 11.9% |
| UVA | 56,439 | 9,190 | 16.2% | 19% |
| Williams | 10,315 | ~1,010 | 9.8% | 8.5% |
Highly-Selective Colleges & Universities Facts & Trends:
Amherst
- The number of international students rose from 9 percent to 12, with 54 different countries represented.
- The number of applications this year is a decline from the past two years’ record highs, a 14.2-percent drop from the 14,800 applicants to the class of 2026.
Duke
- The Early Decision acceptance rate was the lowest in history at 16.5%.
- There were 44,589 Regular Decision applicants, bringing the acceptance rate for Regular Decision to 4.8%.
Emory
- Admitted students in the Class of 2027 represent all 50 states and 77 countries.
- For the Class of 2027, 61% applied to both colleges, a growing trend in recent years.
Georgetown
- The College of Arts & Sciences saw the highest number of applicants, receiving 15,484 applications and admitting 1,911 for a 12.3% acceptance rate.
- The McDonough School of Business had a 12% acceptance rate with 4,210
MIT
- Admitted students hail from all 50 states, 63 countries, and nearly 900 different high schools.
- They received fewer than the 33,796 who applied last year, before they reinstated their testing requirement, but more than the 20,075 who applied for entry to the MIT Class of 2024.
NYU
- The admitted class represents a median SAT score of 1540.
- Admitted students hail from all 50 states, the District of Columbia, and Puerto Rico, and represent 86 countries
Northwestern
- Northwestern has confirmed that it will remain test-optional for the 2023–2024 admissions cycle.
- The class will ultimately only include roughly 2,100 students
Rice
- Students who did not submit a test score made up 21% of the admitted class.
- They anticipate enrolling a freshman class of 1100 new Owls in the Fall.
Swarthmore
- This year, the class of admits is composed of students from 53 different countries, with 118 students possessing dual citizenship.
- 34 percent of admits were first-generation college students.
Tufts
- While 28% of admitted students are from New England, 20% are from the West, 10% from the South, and 5% from the Southwest.
- Admissions staff conducted in-person events in 27 states and 16 countries on four continents, including programs in South Korea, India, the United Kingdom, Jordan, and Argentina, among many others.
USC
- USC set a record with the percentage of admitted students who are first generation college students. This year, first generation students make up 23% of admitted applicants.
- Approximately 12,000 more students applied to USC this year than in 2022, and 10,000 more than the previous record set in 2021.
UVA
- In-state applicants were admitted at a 27% clip vs. just 12% for out-of-state students.
- The School of Engineering and Applied Science offered 1,882 students admission, also lower than the 1,969 students accepted last year.
Williams
- The school waitlisted 1,970 students and denied admission to 7,487.
- During the past five admission cycles, the College has accepted an average of 35 students off the waiting list..
Check back for more updates on Class of 2027 acceptance rate data as it becomes public.
Class of 2027 Ivy League Acceptance Rates – Additional Resources
- The Hardest Colleges to Get Into
- What are Ivy League Schools?
- College Investigator – Free college search and list-building tool
