Nearly seven out of eight students MIT admits decide to attend. In an admissions world where the most selective private universities fight over cross-admits and count a 45 percent yield as strong, MIT enrolled 86.4 percent of its admitted students for Fall 2025. That number has not dropped below 84 percent in five years, and it is the single most unusual figure in MIT’s file. It means the admit rate and the yield describe almost the same group of students, and it means MIT can seat a class of roughly 1,100 first-years on about 1,300 offers rather than the two-for-one or three-for-one that its peers require.
That is the frame for everything else. A university that keeps nearly every student it admits does not need binding early rounds, does not need a large waiting list, and does not need to over-admit against melt. What it needs is to read a very deep applicant pool and pick about 1,300 students out of it, and the five-year record is mostly a story of MIT doing that with remarkable consistency while the world around it changed.
This report covers five entering classes, Fall 2021 through Fall 2025, drawn from MIT’s Common Data Set filings published by the Institute’s Office of Institutional Research. It works through the application swing that followed the return of required testing, an admit rate that has held near four and a half percent, the extraordinary yield, a testing profile that sits at the ceiling of the scale, the demographic reshaping that followed the 2023 Supreme Court decision, an aid model that now covers full tuition for most families, and the concentration of the undergraduate body into a single department. It closes with what the record suggests for applicants, including the part MIT states more plainly than any peer, that it does not admit by major.
Application volume and selectivity
MIT’s applicant pool did something in this window that almost no other university’s did. It fell, sharply, and then began to climb back.
| Metric | 2021-22 | 2022-23 | 2023-24 | 2024-25 | 2025-26 |
| Applications | 33,240 | 33,767 | 26,914 | 28,232 | 29,281 |
| Admits | 1,365 | 1,337 | 1,291 | 1,284 | 1,334 |
| Admit rate | 4.1% | 4.0% | 4.8% | 4.5% | 4.6% |
| Enrolled | 1,177 | 1,136 | 1,092 | 1,106 | 1,152 |
| Yield | 86.2% | 85.0% | 84.6% | 86.1% | 86.4% |
Source: MIT Common Data Sets, Section C1, entering classes Fall 2021 through Fall 2025. Admit rate = admits divided by applications. Yield = enrolled divided by admits. The Fall 2023 filing notes that MIT revised its admissions classification methodology in February 2025.
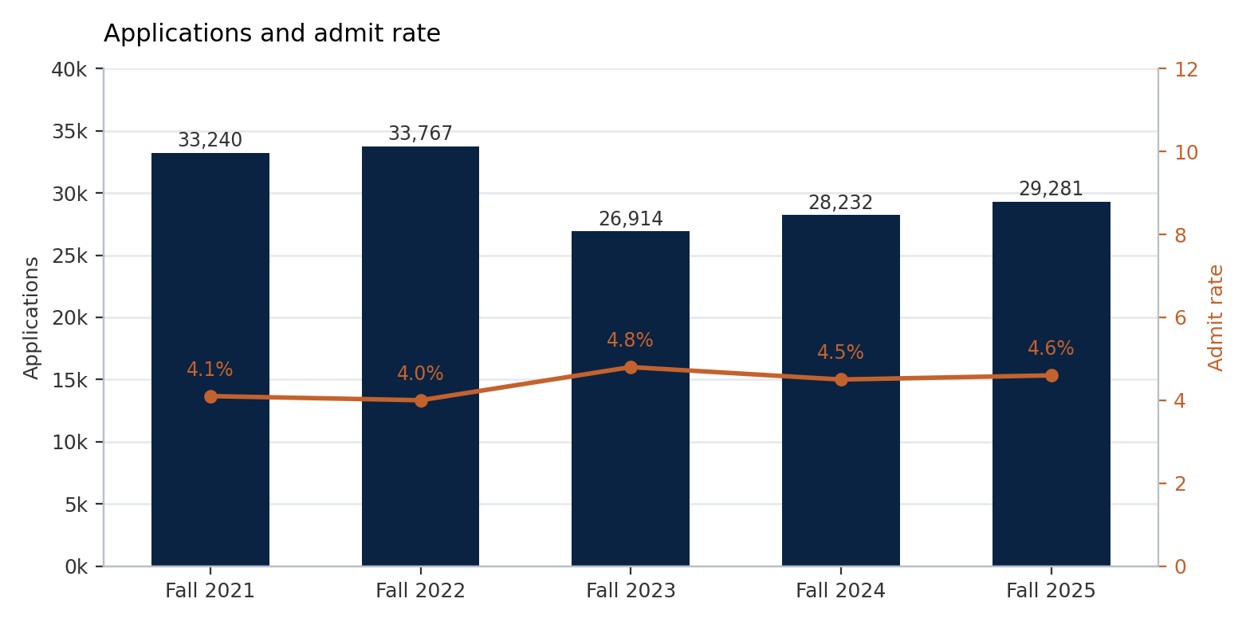
Applications and overall admit rate, Fall 2021 to Fall 2025. Source: MIT Common Data Sets, Section C1.
The pool peaked at 33,767 for Fall 2022 and fell to 26,914 for Fall 2023, a drop of more than 6,800 applications, or twenty percent, in a single cycle. The timing points to one cause. MIT suspended its testing requirement for the Fall 2021 and Fall 2022 cycles during the pandemic, then reinstated it for Fall 2023 and every cycle since, one of the first universities in the country to bring the SAT or ACT back. The test-optional years drew tens of thousands of additional applicants who did not have to weigh whether their scores cleared MIT’s bar; the return of the requirement removed most of them at once. The pool has since recovered part of the ground, rising to 29,281 for Fall 2025, but it has not returned to its test-optional peak.
The admit rate tells the mirror image. It sat at 4.0 percent in the deepest-pool year, rose to 4.8 percent when the pool contracted, and has settled near 4.6 percent. The practical selectivity did not really loosen, because the applicants who stopped applying when scores came back were disproportionately those least likely to be admitted. MIT admitted between 1,284 and 1,365 students every year of the window, a band of fewer than a hundred, which is the real constant in the table. The rate moves because the denominator moves, not because the Institute changed how many students it wanted.
The yield that changes everything
MIT enrolls a share of its admitted students that has no equal among large private research universities.
| Yield metric | 2021-22 | 2022-23 | 2023-24 | 2024-25 | 2025-26 |
| Admits | 1,365 | 1,337 | 1,291 | 1,284 | 1,334 |
| Enrolled | 1,177 | 1,136 | 1,092 | 1,106 | 1,152 |
| Yield | 86.2% | 85.0% | 84.6% | 86.1% | 86.4% |
Source: MIT Common Data Sets, Section C1, entering classes Fall 2021 through Fall 2025. Yield = enrolled first-year students divided by admitted first-year students.
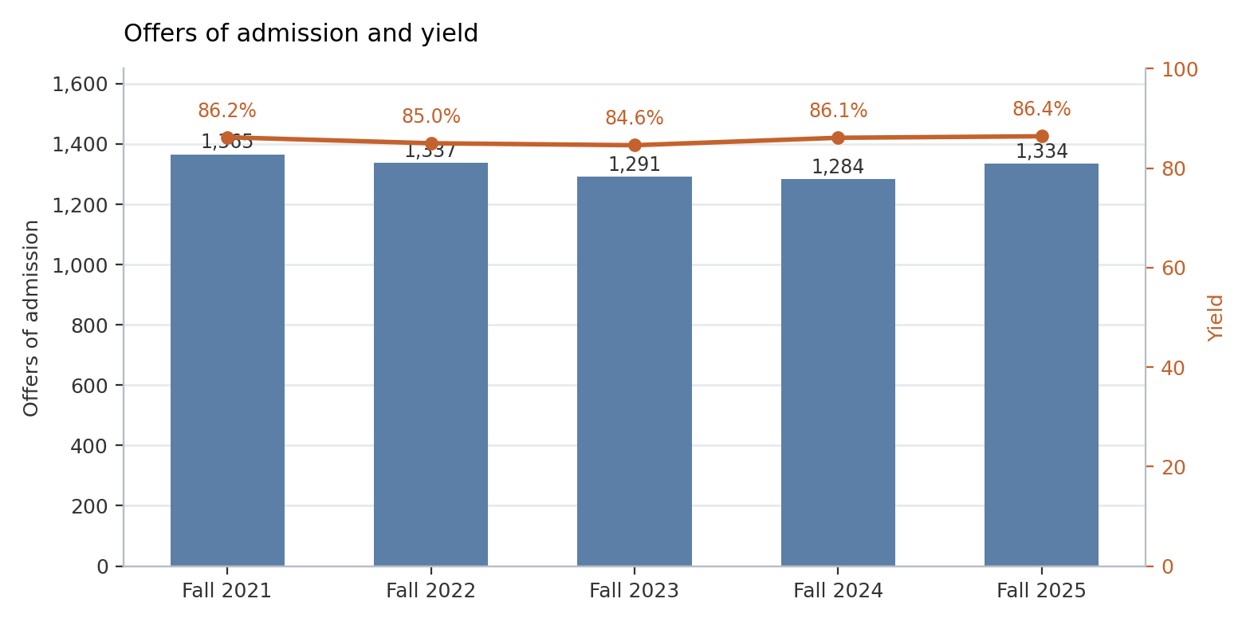
Offers of admission and yield, Fall 2021 to Fall 2025. Source: MIT Common Data Sets, Section C1.
A yield in the mid-eighties changes the arithmetic of the whole operation. Consider what it takes to seat 1,150 students. MIT extends about 1,330 offers. A university yielding 30 percent would need to extend more than 3,800 offers to seat the same class, and would have to manage the risk that too many or too few say yes. MIT carries almost none of that risk. It knows that the students it admits will overwhelmingly come, which is why it runs a single non-binding Early Action round with no Early Decision, no binding commitment, and a waiting list it barely uses.
The reason for the yield is not a mystery. MIT competes for cross-admits with a very short list of universities, it is need-blind for domestic and international applicants alike, it meets full demonstrated need, and for most of this window it has offered a distinctive product that its overlap schools cannot fully match in engineering and the physical sciences. A student admitted to MIT and to three Ivies still chooses MIT most of the time. That is the behavior the yield encodes.
The entering class itself has stayed close to fixed. It ran 1,177 for Fall 2021, dipped to 1,092 for Fall 2023, and recovered to 1,152 for Fall 2025. MIT is not trying to grow its undergraduate body, which sits near 4,500, and the small year-to-year movement reflects how the yield landed against a target rather than any deliberate expansion or contraction.
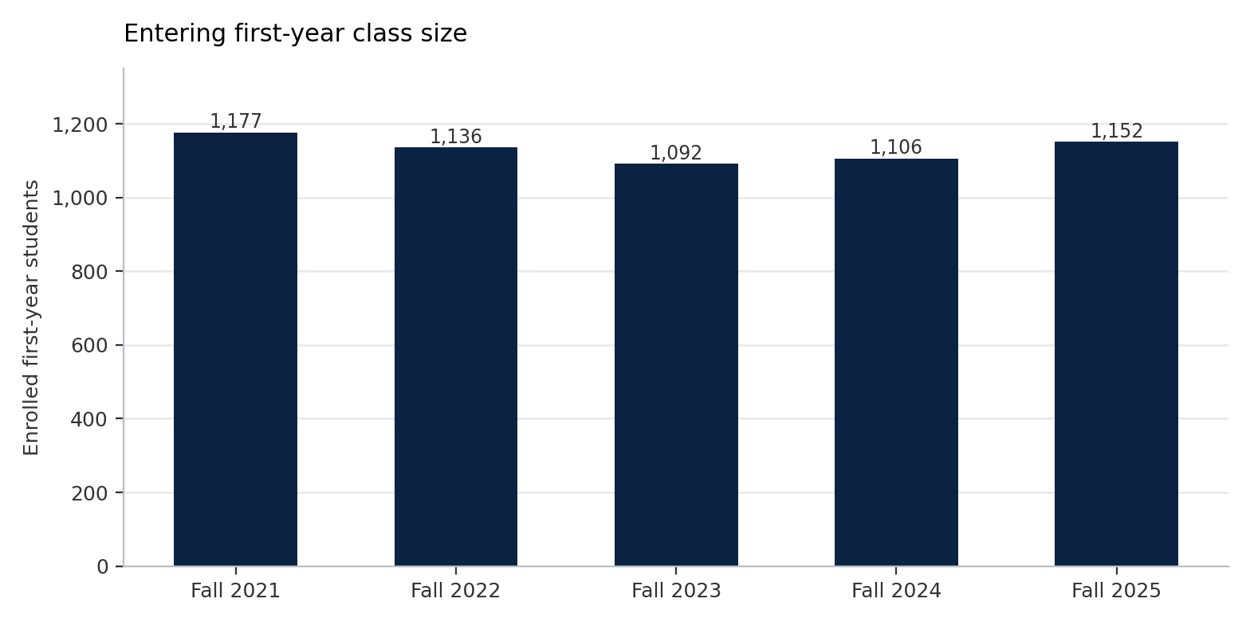
Entering first-year class size, Fall 2021 to Fall 2025. Source: MIT Common Data Sets, Section C1.
A waiting list held in reserve
Because the yield is so predictable, MIT rarely needs to go to its waiting list, and the numbers show it.
| Waiting list | 2021-22 | 2022-23 | 2023-24 | 2024-25 | 2025-26 |
| Offered a place | 632 | 763 | 619 | 590 | 561 |
| Accepted a place | 501 | 682 | 558 | 509 | 468 |
| Admitted from the list | 25 | 0 | 32 | 9 | 10 |
Source: MIT Common Data Sets, Section C2, Fall 2021 through Fall 2025.
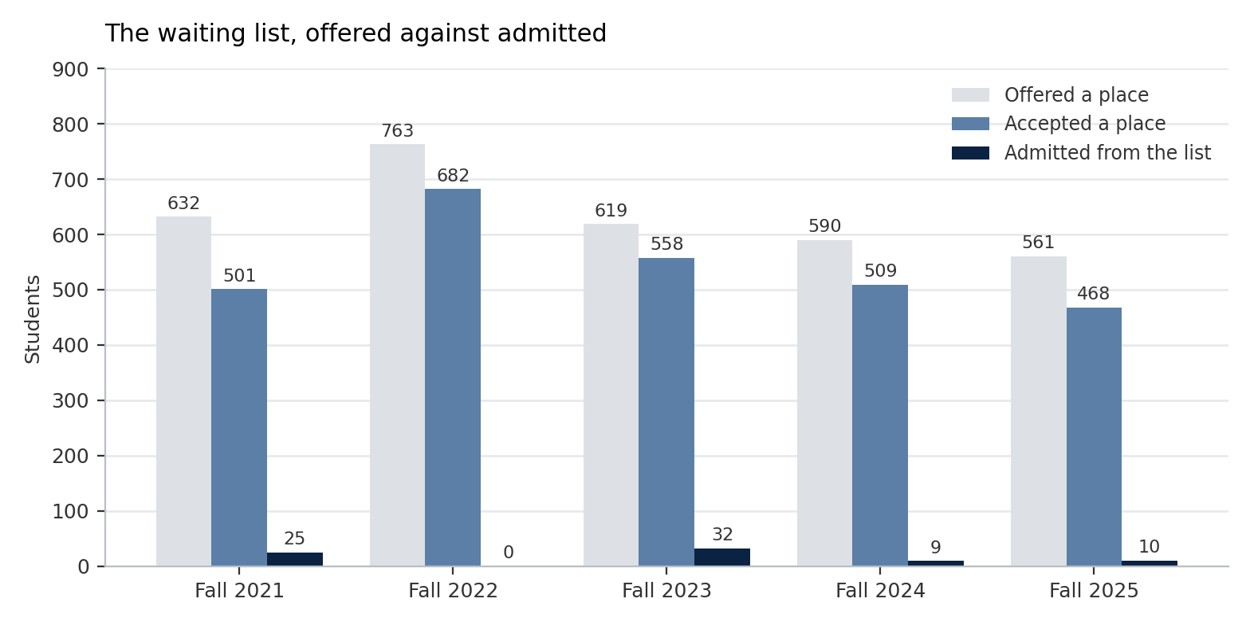
Waiting list offers, acceptances, and admits, Fall 2021 to Fall 2025. Source: MIT Common Data Sets, Section C2.
MIT took zero students from its list for Fall 2022 and never more than 32 in any year of the window. Against roughly five hundred students who accept a place each year, that is an admit rate off the list of between zero and about six percent. A waiting list offer from MIT is a genuine long shot, and its size relative to the tiny number eventually admitted reflects a university that keeps a buffer it seldom needs to draw on. The list is unranked, and MIT does not tell students or counselors where they stand on it.
A testing profile at the ceiling
MIT reinstated the SAT or ACT requirement beginning with the Fall 2023 entering class and has required it since. The submission shares in the table below reflect that shift, and the score ranges show why testing at MIT is less a filter than a formality for the students who enroll.
| Metric (enrolled first-years) | 2021-22 | 2022-23 | 2023-24 | 2024-25 | 2025-26 |
| Submitting SAT | 70% | 78% | 83% | 83% | 83% |
| Submitting ACT | 34% | 32% | 31% | 29% | 31% |
| SAT composite 25th-75th | 1510-1570 | 1520-1570 | 1520-1570 | 1520-1570 | 1520-1570 |
| SAT Math 25th-75th | 780-800 | 790-800 | 780-800 | 780-800 | 780-800 |
| ACT composite 25th-75th | 34-36 | 35-36 | 34-36 | 34-36 | 34-35 |
Source: MIT Common Data Sets, Section C9, enrolled first-year students. Submission shares exceed 100 percent combined because some students submit both tests. MIT does not collect or report high school GPA.
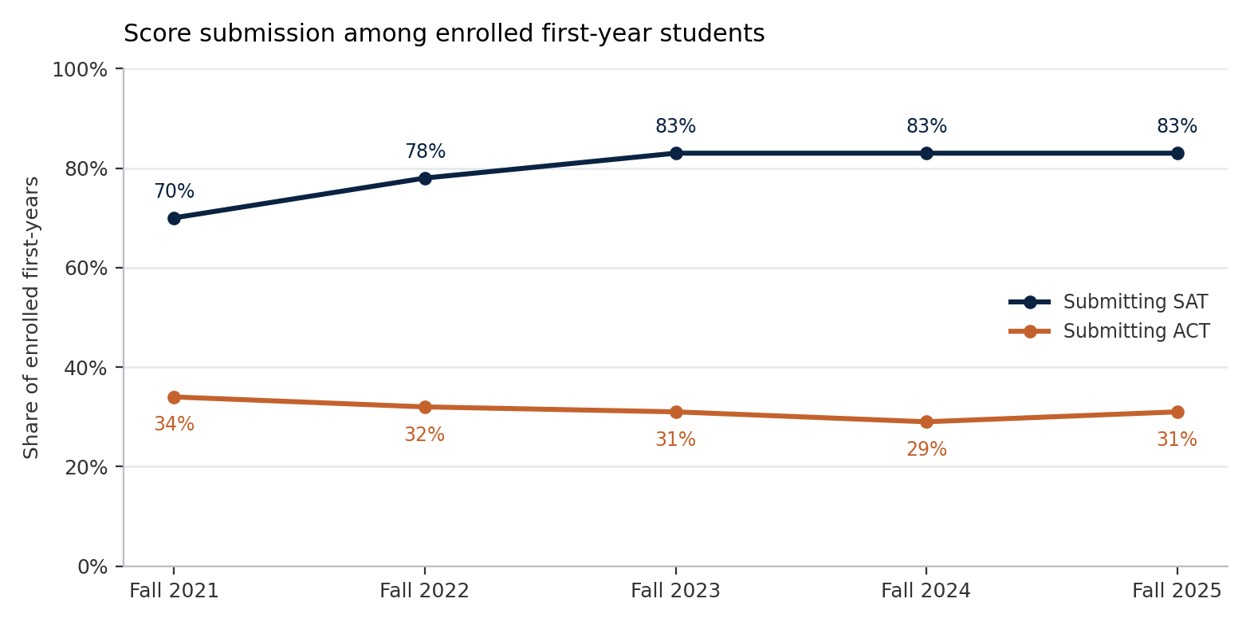
Share of enrolled first-year students submitting SAT and ACT scores, Fall 2021 to Fall 2025. Source: MIT Common Data Sets, Section C9.
SAT submission climbed from 70 percent to 83 percent once the requirement returned, since scores are now mandatory and the remaining students submit the ACT instead. The composite band barely moved across five years, from a floor of 1510 to 1520 and a ceiling of 1570 throughout. Those numbers describe a class at the top of the scale. In the Fall 2025 filing, 99.79 percent of SAT Math submitters scored in the 700 to 800 range, and 99.16 percent of composite submitters scored 1400 or above. The 25th percentile in SAT Math has sat at 780 or 790 every year, which means at least three-quarters of enrolled students scored 780 or above out of a possible 800.
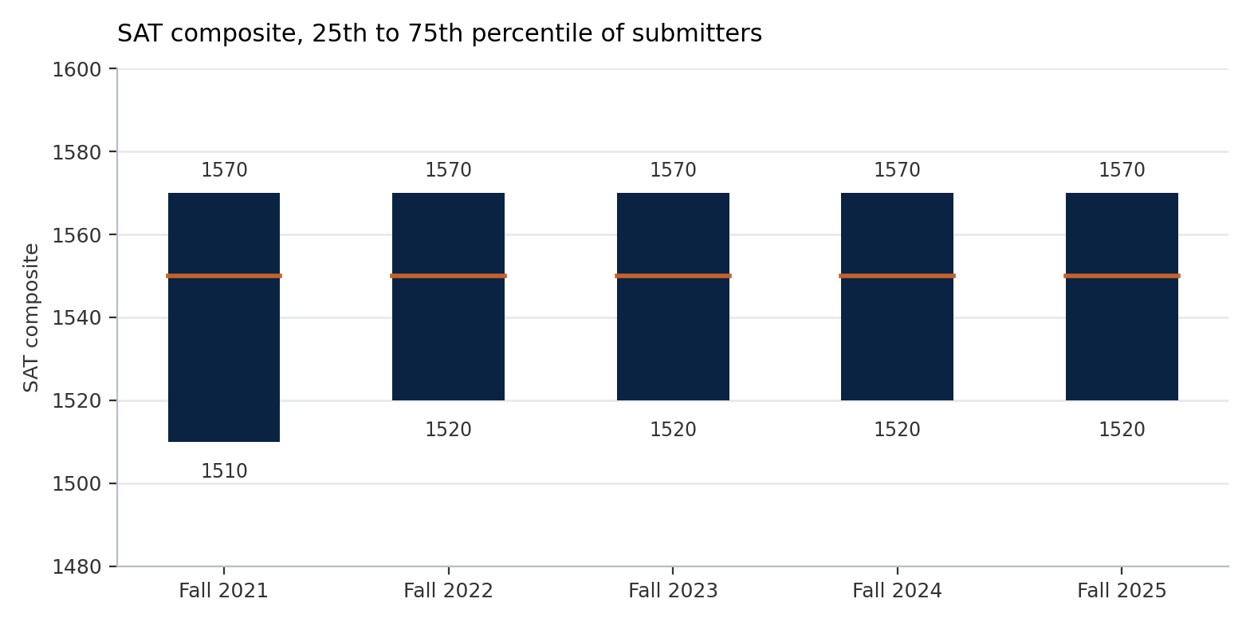
SAT composite, 25th to 75th percentile of enrolled submitters, with median marked. Source: MIT Common Data Sets, Section C9.
The class-rank data reinforces the picture. Among students who submitted a rank, 97 percent stood in the top tenth of their high school class for Fall 2025, and 100 percent in the top quarter. Only about 31 percent of the class submitted a rank at all, because so many high schools no longer report one, so MIT reads the rest through course rigor and school context. The signal from the testing section is blunt: for the students MIT enrolls, a top score is close to universal, and the admission decision turns on everything else in the file.
What the file actually weighs
MIT’s C7 disclosure is unusual, and it rewards a careful reading. Not a single academic factor is rated very important.
| Very important | Important | Considered | Not considered |
| Character and personal qualities | Rigor of secondary school record | Class rank | Interview |
| Academic GPA | First generation | Alumni relation | |
| Standardized test scores | Geographical residence | State residency | |
| Application essay | Volunteer work | Religious affiliation | |
| Recommendations | Work experience | Level of applicant’s interest | |
| Talent and ability | |||
| Extracurricular activities | |||
| Interview |
Source: MIT Common Data Set 2025-2026, Section C7. Interview is rated important as a nonacademic factor. The racial and ethnic status row, rated considered through the 2021-22 filing, was removed from the form after the June 2023 Supreme Court decision.
One entry sits alone in the very important column, and it is not academic. Character and personal qualities is the only factor MIT rates at the top tier, in every year of the window. Rigor of the secondary school record, GPA, test scores, the essay, recommendations, and talent all sit one rung down, at important. The message is deliberate. Among a pool where nearly everyone has the grades and scores to succeed, MIT decides on who the applicant is, not on whether they clear an academic threshold that most of the pool already clears.
Two other placements stand out. The interview is rated important, higher than at most universities, and MIT conducts interviews through a network of volunteer educational counselors; declining one when it is offered removes a factor MIT actually weighs. And level of applicant’s interest is not considered at all, which follows from the yield. A university that keeps 86 percent of its admits has no reason to reward demonstrated interest, because it does not lose students it wants. Alumni relation and state residency are likewise not considered, consistent with MIT’s public position that it offers no legacy preference.
Who enrolls, before and after 2023
MIT is overwhelmingly a national and international university. About 91 percent of its first-year students come from outside Massachusetts, and roughly one undergraduate in nine is an international student, a share that has held even as immigration policy has grown less welcoming. The racial composition, though, changed in a way that the timing ties directly to the 2023 Supreme Court decision ending race-conscious admissions.
| Share of undergraduates | 2021-22 | 2022-23 | 2023-24 | 2024-25 | 2025-26 |
| Asian | 33.2% | 34.1% | 34.6% | 35.2% | 35.9% |
| White | 24.1% | 22.1% | 21.0% | 21.3% | 21.6% |
| Hispanic or Latino | 15.2% | 14.8% | 14.5% | 14.1% | 13.9% |
| Nonresident | 10.2% | 11.0% | 10.9% | 11.7% | 11.6% |
| Black or African American | 7.3% | 7.8% | 8.7% | 7.7% | 6.7% |
| Two or more races | 7.9% | 7.4% | 7.2% | 6.8% | 6.5% |
Source: MIT Common Data Sets, Section B2, degree-seeking undergraduates. Under federal reporting rules, Hispanic, multiracial, and international students are counted separately rather than within a single race.
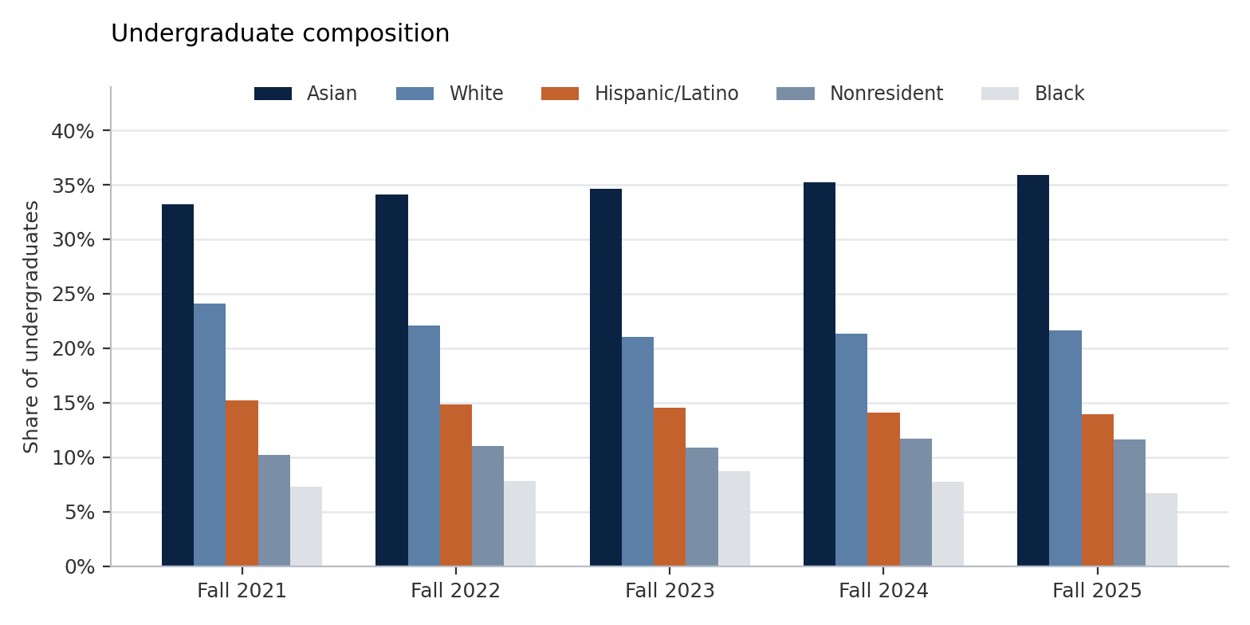
Undergraduate composition, Fall 2021 to Fall 2025. Source: MIT Common Data Sets, Section B2.
The sharpest movement shows up in the first-time first-year rows behind these totals. The Supreme Court’s June 2023 decision ending race-conscious admissions first applied to the class MIT admitted in early 2024, which entered that fall. In that first race-blind entering class, the Black share of first-year students fell from 9.0 percent for Fall 2023 to 3.7 percent for Fall 2024, the Hispanic share from 15.7 to 10.7 percent, while the Asian share rose from 35.5 to 42.1 percent, a pattern MIT reported publicly and one echoed across its peer group. The Fall 2025 class recovered part of the ground, with the Black share of first-years back to 5.9 percent and the Hispanic share to 12.9 percent. The undergraduate totals in the table above move more slowly because they blend four classes together, but the Black share of all undergraduates has already fallen from 8.7 to 6.7 percent in two years, and the Asian share has risen every year of the window, from 33.2 to 35.9 percent, and is now the largest single group among undergraduates.
MIT’s own gender balance is worth a line. The Institute enrolls very close to an even split, with women making up about 48 percent of undergraduates, which is a notable figure at a university built around engineering and computing and higher than at most of its technical peers.
Cost, and an aid model that removed tuition for most families
MIT’s published price rose steadily across the window, and the more important story is what sits underneath it.
| Academic year | 2022-23 | 2023-24 | 2024-25 | 2025-26 | 2026-27 |
| Tuition and required fees | $57,986 | $60,156 | $62,396 | $64,730 | $67,140 |
| Housing and food | $18,790 | $19,390 | $20,280 | $21,264 | $22,194 |
Source: MIT Common Data Sets, Section G1. Each filing reports costs for the following academic year, so the 2026-27 figures come from the 2025-26 filing.
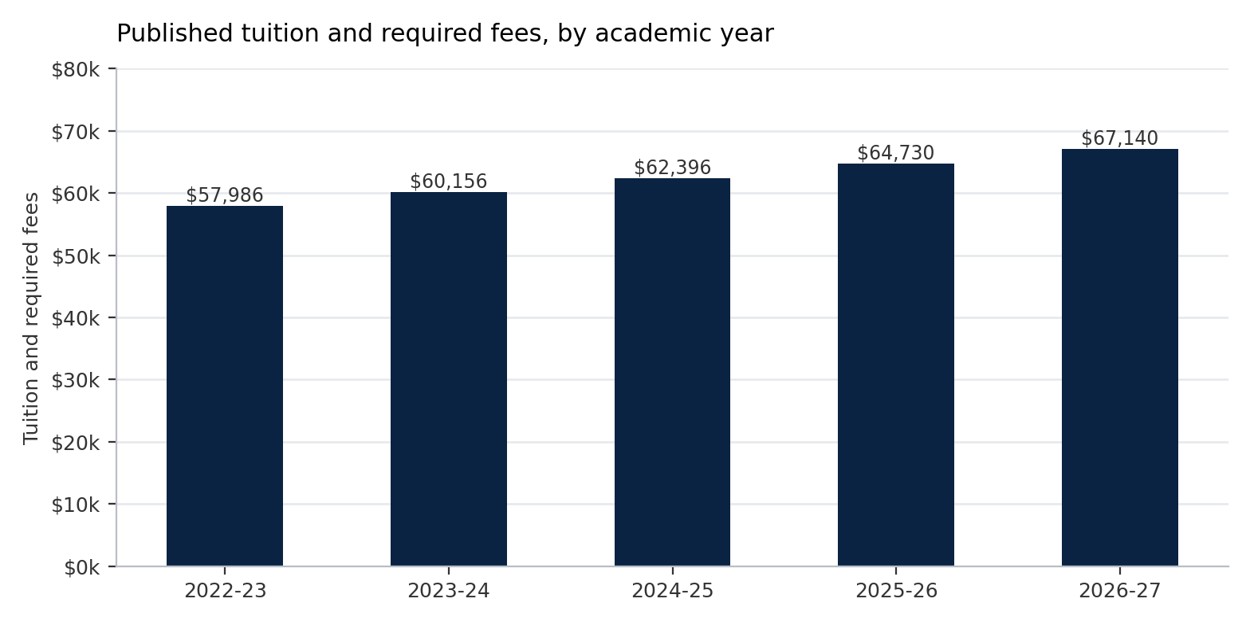
Published tuition and required fees by academic year. Source: MIT Common Data Sets, Section G1.
Tuition, fees, housing, and food reach about $89,300 for 2026-27. Very few MIT families pay it. MIT is need-blind for all applicants, foreign and domestic, one of a small number of American universities that make that commitment, and it meets 100 percent of demonstrated need for every year of this window with grants rather than loans. The average need-based grant for first-year students climbed from $57,024 in 2021-22 to $73,398 in 2025-26, a 29 percent increase that outpaced the sticker price, and between 54 and 60 percent of each first-year class received one.
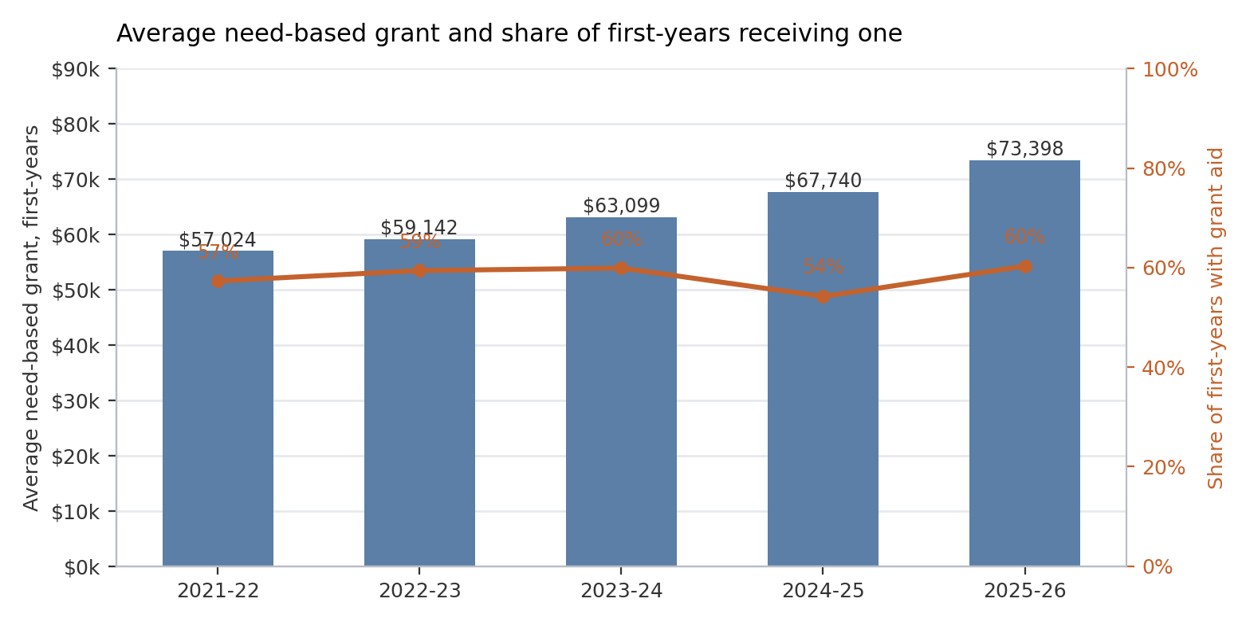
Average need-based grant and share of first-year students receiving one. Source: MIT Common Data Sets, Sections H2 and H2A.
The policy behind those numbers moved twice during the window, both times toward more generous thresholds. MIT guaranteed free tuition for families earning under $140,000 beginning in 2022-23, then in November 2024 raised the threshold so that families earning under $200,000 with typical assets attend tuition-free, and families under $100,000 pay nothing at all toward the full cost of attendance, both effective for the Fall 2025 class. MIT reports no non-need-based or merit aid whatsoever, which is consistent across every filing; there are no scholarships to compete for, only need to demonstrate. The Institute’s endowment, at $27.4 billion as of June 2025, is what makes the model possible.
Borrowing is correspondingly light. In the Class of 2025, 13 percent of graduates borrowed anything at all, with an average cumulative debt near $41,000 among that minority, and only about 10 percent borrowed through federal programs. For most MIT graduates, the debt figure is zero.
Persistence, completion, and the classroom
MIT retains and graduates its students at rates that sit near the top of American higher education, and they have not moved.
First-year retention has held at 99 percent for every entering cohort in the window, one of the highest figures any university reports. The six-year graduation rate stood at 95 to 96 percent for the 2015 through 2019 entering cohorts, and four-year completion for the 2019 cohort was 86 percent. The gaps that open at most universities barely register here. For the 2019 cohort, Pell recipients graduated within six years at 91 percent against 97 percent for students who received neither Pell nor a subsidized loan, a wider spread than the wealthiest universities show but still a completion rate for low-income students that most institutions cannot approach.
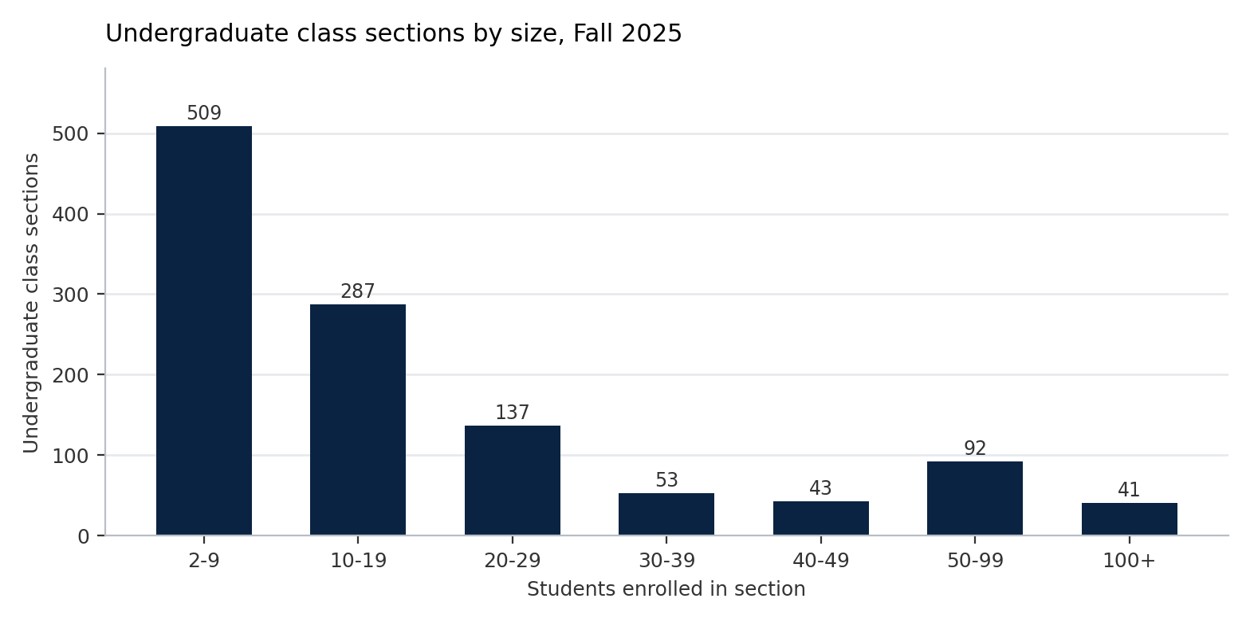
Undergraduate class sections by size, Fall 2025. Source: MIT Common Data Set 2025-2026, Section I3.
The classroom is smaller than MIT’s research reputation might suggest. Of 1,162 undergraduate class sections in Fall 2025, 509 enrolled fewer than ten students and 796 enrolled fewer than twenty, against 41 sections of a hundred or more. MIT reported a student-to-faculty ratio of 8 to 1 for Fall 2025, up from the 3 to 1 it published in prior years, after it changed the calculation to count all students rather than undergraduates alone. Either way, the class-size distribution is the more honest measure of the undergraduate experience, and it shows a university where most sections are small even though the large introductory lectures in mathematics and computing are very large indeed.
The one department that dominates
MIT’s degree mix has tilted toward computing in a way that is visible in the CDS and even starker in the Institute’s own enrollment counts.
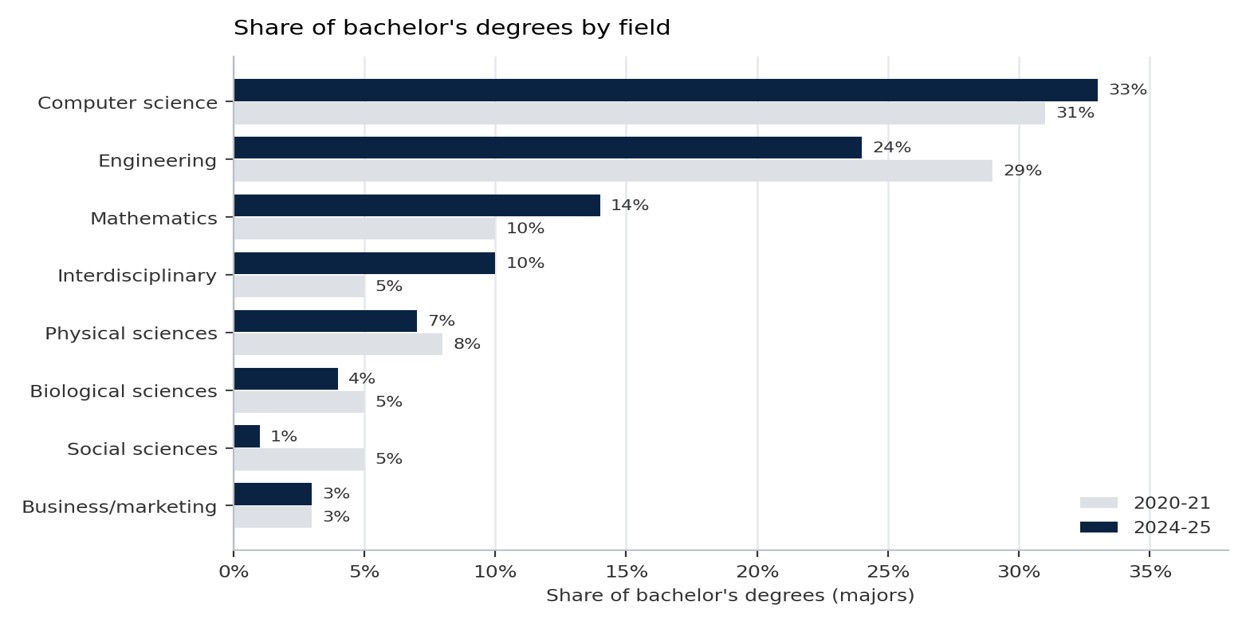
Share of bachelor’s degrees by field, 2020-21 against 2024-25. Source: MIT Common Data Sets, Section J.
Computer and information sciences rose from 31 percent of bachelor’s degrees to 33 percent across the window, and engineering accounts for another 24 percent, so the two together produce roughly 57 percent of MIT degrees. Mathematics has grown from 10 to 14 percent, and interdisciplinary programs, many of them computing-adjacent, from 5 to 10 percent. The physical sciences, biological sciences, and the social sciences and humanities together account for the remainder, each a small slice at a university whose center of gravity has moved decisively toward computation.
The CDS understates the concentration, because it counts degrees by field rather than students by department. MIT’s own registrar figures for 2025-26 show that 44 percent of the undergraduate population is majoring in Course 6, the Department of Electrical Engineering and Computer Science, and that EECS students account for a third of all double majors. A university with 53 majors sees nearly half its students choose one department. That concentration shapes the undergraduate experience more than any single admissions statistic, because it determines which introductory classes are enormous, where the competition for research positions and teaching assistantships is fiercest, and which job market most graduates enter.
No admission by major, and why it counts
Here the usual question this series asks, how competitive is one major against another, has an answer MIT gives more directly than any peer. There is no competition between majors at the point of admission, because MIT does not admit by major. Every applicant applies to the Institute as a whole, every admitted student arrives undeclared, and students choose a department, called a Course, no earlier than the spring of first year and no later than the end of second year.
MIT states the consequence plainly in its own admissions materials. The application asks for a course of interest, but that choice has no impact on the admission decision, and the Institute notes that roughly half of its students end up majoring in something other than what they listed as applicants. There are no departmental quotas to fill, no secondary admission into an impacted major, and no advantage to signaling commitment to a popular field. An applicant interested in Course 6 is neither helped nor hurt by saying so, and one who is truly undecided is not penalized for it.
What that removes at the front door reappears, in a milder form, after enrollment. Because 44 percent of students converge on one department, the pressure lives inside MIT rather than at its gate. The competition an applicant should anticipate is not for a seat in a major but for a spot in a research group, a popular seminar, or a teaching assistantship within the most crowded courses. Any student admitted to MIT can major in computer science; the question is what the experience of doing so alongside a plurality of the class looks like, and that is a question about the Institute’s internal life rather than its admissions math.
Beyond the numbers
Three developments outside the Common Data Set shape what a student entering MIT in the next few years will find, and all three trace to federal policy in 2025 and 2026.
The first is money. A 2025 federal law raised the tax on large university endowment returns from 1.4 percent to 8 percent, and MIT, with a $27.4 billion endowment, is among the handful of universities most exposed. Combined with reduced federal research funding, the Institute has projected roughly $300 million in annual budget pressure, imposed a staff hiring freeze, and cut academic and administrative unit budgets by 5 to 10 percent beginning in March 2025. President Sally Kornbluth said in May 2026 that campus research funded by federal awards had fallen more than 20 percent year over year and that total sponsored research activity was down about 10 percent. MIT has publicly committed to protecting undergraduate financial aid through these cuts, so the tuition-free thresholds described above are not at risk, but the research enterprise that surrounds undergraduate life is contracting.
The second is the graduate pipeline, which matters to undergraduates more than it first appears. Kornbluth said graduate enrollment would fall about 20 percent, roughly 500 fewer students, as faculty grew hesitant to admit doctoral students they might not be able to fund. Fewer graduate students means fewer teaching assistants and fewer research mentors for undergraduates, particularly in the crowded computing courses, and it is the clearest way the funding squeeze reaches the classroom.
The third is the applicant pool itself. MIT rejected the federal administration’s proposed compact on higher education in October 2025, one of the first universities to do so, and Kornbluth has said that policy changes affecting international students and scholars are already discouraging strong applicants from applying. MIT’s need-blind international admission and its even gender balance are distinctive commitments, and both sit in an environment that has grown more hostile to the international recruitment on which the Institute has long relied.
What the five-year record means for applicants
MIT is the rare university where the headline admit rate, near 4.6 percent, understates almost nothing, because the yield is so high that the students admitted are very nearly the students who enroll. There is no binding early lever to pull. MIT’s Early Action is non-binding and non-restrictive, and it confers no meaningful statistical advantage of the kind that binding Early Decision gives at other universities, because MIT has no melt to manage. Applying early buys an earlier answer, not better odds.
The testing requirement is real and it is not optional. Every applicant submits an SAT or ACT, and the enrolled class scores at the ceiling of the scale, with a quarter of students at or near a perfect math score. A strong score does not distinguish an applicant at MIT, because nearly everyone in the admitted pool has one; a weak score is disqualifying in a way it is not at test-optional universities. The score gets an applicant considered, and then the decision turns on the one factor MIT rates above all others, character and personal qualities, read through the essay, the recommendations, and the volunteer interview.
The financial case is unusually clean. There is no merit aid to chase and no scholarship competition to win, only need to demonstrate, and for families earning under $200,000 the tuition is free, with families under $100,000 paying nothing toward the full cost. An applicant weighing MIT against a university that offers large merit scholarships should run both net prices, because MIT’s need-based model can beat a nominal merit award for many middle-income families. And the applicant who worries about getting into the right major can stop worrying about that particular thing, because MIT does not admit by major and never has. The competition at MIT is to be admitted at all; once in, the choice of what to study is the student’s own.