Princeton enrolled 5,321 undergraduates in the fall of 2021 and 5,916 in the fall of 2025. That gain of nearly 600 students is close to the population of a full residential college, and Princeton opened two of them, Yeh College and New College West, in the fall of 2022 to make room. Over the same five admissions cycles the university’s first-year admit rate hardly moved. It read 4.4 percent for the Class of 2025 and 4.4 percent again for the Class of 2029, with a single detour in between. Applications rose every year, from 37,601 to 42,303. Princeton grew the class, absorbed a record applicant pool, and held selectivity almost perfectly flat.
The five Common Data Sets covering Fall 2021 through Fall 2025 describe a university that expanded on purpose without giving an inch on selectivity. Very few schools manage that. When a college adds students, the admit rate usually ticks up, because more beds mean more offers against a similar pool. Princeton avoided it by riding a rising tide of applications and a yield that stayed among the highest in the country. Three out of every four admitted students enroll, which lets the admissions office keep offers scarce while the class grows underneath it.
What follows walks through that record and turns to a set of admissions and academic trends that sit outside the Common Data Set but shape how the numbers should be read, including where competition between fields actually lives.
Application volume and selectivity
Princeton received 42,303 first-year applications for the Class of 2029, the largest pool in its history and up about 12 percent from the 37,601 it saw five years earlier. Admit offers stayed contained. In four of the five years the university admitted between 1,647 and 1,868 students. The exception was the Class of 2026, the first class of the expansion, when Princeton admitted 2,167 and enrolled its largest first-year cohort of the period.
| Metric | 2021–22 | 2022–23 | 2023–24 | 2024–25 | 2025–26 |
| Applications | 37,601 | 38,019 | 39,644 | 40,468 | 42,303 |
| Admits | 1,647 | 2,167 | 1,782 | 1,868 | 1,868 |
| Admit rate | 4.4% | 5.7% | 4.5% | 4.6% | 4.4% |
| Enrolled | 1,290 | 1,499 | 1,366 | 1,410 | 1,408 |
| Yield | 78.3% | 69.2% | 76.7% | 75.5% | 75.4% |
Source: Princeton University Common Data Sets, Section C1, 2021–22 through 2025–26. Admit rate = admits divided by applications. Yield = enrolled divided by admits.

Applications and admit rate, Fall 2021 to Fall 2025
Applications and admit rate, Fall 2021 to Fall 2025. Source: Princeton University Common Data Sets, C1.
The one anomaly in the table explains itself once the expansion is in view. To open two new residential colleges and lift its undergraduate population, Princeton needed a bigger entering class in the fall of 2022. Post-pandemic yield was harder to predict that cycle, so the office admitted more students to be safe, and yield came in at 69 percent, its lowest of the five years. That pushed the admit rate up to 5.7 percent for a single cycle. By the following year yield had recovered to the mid-70s, the target class settled near 1,400, and the admit rate returned to its usual place just above 4 percent.
The steadier story is the yield itself. Outside the 2022 dip, Princeton converted roughly 75 to 78 percent of its admitted students into enrollees every year. That figure is a structural advantage. Princeton rarely loses a cross-admit battle, so it can extend a small number of offers and still fill a growing class.
The waiting list is a reserve, not a channel
The clearest contrast between Princeton and a large public flagship shows up in the waitlist. At schools managing volatile yield against fixed capacity, the waiting list has become a primary admissions channel, with hundreds or thousands of admits flowing from it each spring. Princeton uses it the opposite way, as a reserve it touches only when the math requires.
| Metric | 2021–22 | 2022–23 | 2023–24 | 2024–25 | 2025–26 |
| Offered a waitlist place | 1,265 | 1,710 | 1,302 | 1,734 | 1,370 |
| Accepted a waitlist place | 1,000 | 1,348 | 1,032 | 1,396 | 1,086 |
| Admitted from the waitlist | 150 | 0 | 52 | 40 | 36 |
Source: Princeton University Common Data Sets, Section C2, 2021–22 through 2025–26.
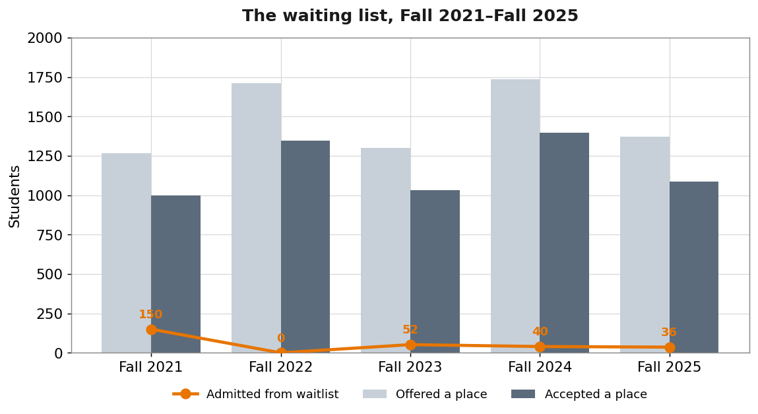
The waiting list, Fall 2021 to Fall 2025
The waiting list, Fall 2021 to Fall 2025. Source: Princeton University Common Data Sets, C2.
Read the orange line. In the fall of 2022, the expansion year, Princeton admitted zero students from a waitlist that more than a thousand people had accepted a place on. It had already extended enough offers to fill the larger class, so the list went untouched. In a normal year the university pulls a few dozen, 36 to 52, from a pool of roughly a thousand who wait. The high-water mark, 150 admits for the Class of 2025, came in the most yield-uncertain cycle of the pandemic, when the office deliberately under-admitted in the regular round and used the list to true up.
For an applicant, a Princeton waitlist result is closer to a soft denial than a live outcome. A student who accepts a place faces something in the range of a 3 to 5 percent chance of an eventual offer in a typical year, and zero in a year when the class fills. Accepting the spot costs nothing and is worth doing, but the practical move is to commit elsewhere and treat any later call as a surprise rather than a plan.
The expansion, retention, and graduation
The population growth was not an accident of a few large classes. It was a deliberate build-out, announced in 2021, to add roughly 125 students per class and raise the undergraduate body by about 10 percent. The enrollment line moved steadily upward across the window, and the persistence numbers moved with it.
| Metric | 2021–22 | 2022–23 | 2023–24 | 2024–25 | 2025–26 |
| Total undergraduates | 5,321 | 5,604 | 5,671 | 5,813 | 5,916 |
| First-year retention | 95.8% | 97.0% | 97.0% | 98.0% | 99.0% |
| Six-year graduation rate | 97.6% | 97.5% | 97.1% | 98.0% | n/a |
Source: Princeton University Common Data Sets, 2021–22 through 2025–26, Sections B1, B4–B11, and B22. Retention figures track the prior fall’s entering cohort. Graduation rates are six-year rates for the 2015 through 2018 entering cohorts, respectively; the 2025–26 filing reports the 2019 cohort at a similar level.
First-year retention climbed from 95.8 percent to 99.0 percent across the five years. The low point sits at the start. That 95.8 percent figure tracks the Fall 2020 cohort, which entered during the first pandemic autumn, when a wave of students took gap years or interrupted enrollment. As that disruption cleared, retention rose to a level almost no university reaches. Six-year graduation rates held between 97 and 98 percent throughout, close to the practical ceiling. A school that admits under 5 percent of applicants and graduates 97 percent of them within six years loses almost no one along the way.
Test scores: paused, not optional
Princeton suspended its standardized testing requirement for the 2020–21 cycle and has renewed that pause every year since, including for students applying in the current cycle. The distinction from ordinary test-optional policy is subtle but real. Princeton continues to accept and consider scores from students who submit them, and a clear majority do, but a file without scores is complete and carries no stated disadvantage.
| Metric | 2021–22 | 2022–23 | 2023–24 | 2024–25 | 2025–26 |
| Submitting SAT | 56% | 60% | 57% | 56% | 60% |
| Submitting ACT | 35% | 25% | 20% | 21% | 20% |
| SAT 25th–75th | 1470–1560 | 1510–1570 | 1510–1560 | 1500–1560 | 1490–1560 |
| SAT 50th | n/a | 1540 | 1540 | 1530 | 1530 |
| Average high school GPA | 3.93 | 3.95 | 3.94 | 3.95 | 3.96 |
Source: Princeton University Common Data Sets, Sections C9 and C12, 2021–22 through 2025–26. Some students submit both the SAT and the ACT, so submission rates sum above 100 percent. The 2021–22 filing reported only 25th and 75th percentiles for the SAT.
The submitting population is elite and has stayed that way. The middle 50 percent of enrolled SAT submitters ran from roughly 1490 to 1570 across the five years, with the 75th percentile pinned at 1560 in four of them. Average high school GPA sat at 3.93 to 3.96 every year, which reflects a class drawn almost entirely from the top of the grading distribution.
Because scores come only from students who chose to send them, these ranges describe self-selected submitters rather than the whole class, and they run higher than the full cohort would. The practical read for an applicant is unchanged. A score near or above the submitting median, around 1530 to 1540 on the SAT, supports a file. A score well below the 25th percentile is a reason to withhold, not a reason to abandon the application, since Princeton means what it says about scoreless files being complete.
What the file actually contains
Princeton admits through a holistic read, and Section C7 of the Common Data Set puts that philosophy in writing. The 2025–26 filing rates the following factors.
| Very Important | Important | Considered | Not Considered |
| Rigor of secondary school record, Academic GPA, Application essay, Recommendations, Character / personal qualities | Extracurricular activities, Talent / ability | Class rank, Standardized test scores, Interview, First generation, Alumni/ae relation, Geographical residence, Volunteer work, Work experience | State residency, Religious affiliation, Level of applicant’s interest |
Source: Princeton University Common Data Set 2025–26, Section C7. Ratings have been stable across the five years, with test scores held in Considered throughout the testing pause.
Three entries deserve emphasis. Recommendations sit in the Very Important column, a higher placement than at many peers who rate them Important. Princeton reads teacher and counselor letters closely, so a student choosing recommenders should pick teachers who can write with specific detail rather than the most impressive name available. Character and personal qualities also rate Very Important, the university’s signal that the essays and the letters are where a reader looks for intellectual seriousness and for the kind of person a student is, not just what they have accomplished.
Standardized test scores sit in Considered rather than Not Considered, consistent with the pause: a strong submitted score can help, and its absence does not hurt. Level of applicant’s interest is Not Considered, so demonstrated interest, campus visits, and repeated contact do not move a Princeton decision. The energy an applicant might spend signaling enthusiasm is better spent on the writing.
Cost, and the aid that rewrites it
Princeton’s published price rose steadily across the period, in line with peer institutions. Tuition increased about 16 percent over the five years, and the total sticker cost of attendance for 2025–26 reached roughly $90,700 once fees, food, housing, books, and personal expenses are added in.
| Academic year | 2021–22 | 2022–23 | 2023–24 | 2024–25 | 2025–26 |
| Tuition | $56,010 | $57,410 | $59,710 | $62,400 | $65,210 |
| Food and housing (on-campus) | ~$17,750 | $18,630 | $19,380 | $20,250 | ~$21,170 |
Source: Princeton University Common Data Sets, Section G1, and Princeton’s published cost of attendance. By CDS convention each year’s G1 reports forward-looking costs, so the figures for 2022–23 through 2024–25 are drawn from the filings that report them; 2021–22 and 2025–26 tuition are Princeton’s published rates.
The sticker price means little for families who qualify for aid, and Princeton’s aid is among the most generous in the country. The university has met 100 percent of demonstrated need with grants rather than loans since 2001, and it strengthened that commitment inside this window. Starting with the 2023–24 year, Princeton eliminated the expected student contribution and moved to cover full costs, including food and housing, for most families earning under $100,000. The effect is visible in the aid data.
| Metric | 2021–22 | 2022–23 | 2023–24 | 2024–25 | 2025–26 |
| Avg need-based grant (first-year) | $61,731 | $62,844 | $70,246 | $71,237 | $79,320 |
| Avg need-based grant (all undergrad) | $61,928 | $62,876 | $71,864 | $73,711 | $80,837 |
| Share of need met | 100% | 100% | 100% | 100% | 100% |
| Share of graduates who borrowed | 17% | 17% | 11% | 9.4% | n/a |
| Average debt per borrower | $10,299 | $12,500 | $17,494 | $18,146 | n/a |
Source: Princeton University Common Data Sets, Section H, 2021–22 through 2025–26. The 2025–26 filing reports aid awarded but not the graduating-class borrowing figures shown for prior years.
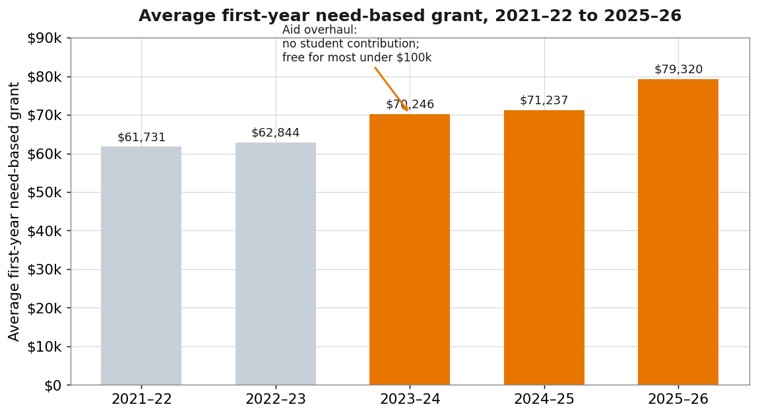
Average first-year need-based grant, 2021-22 to 2025-26
Average first-year need-based grant, 2021–22 to 2025–26. Source: Princeton University Common Data Sets, Section H.
The jump between 2022–23 and 2023–24, when the average first-year grant rose from about $62,800 to about $70,200, lines up exactly with the aid expansion. Grants have kept climbing since, reaching roughly $79,300 for first-year students in the most recent filing.
Borrowing tells a quieter version of the same story. The share of each graduating class taking on any debt fell from 17 percent to under 10 percent as the grant program expanded. Average debt per borrower drifted up, from about $10,300 to about $18,100, which reads at first like a contradiction. The likeliest explanation is composition. As grant aid removed the need to borrow for most students, the remaining borrowers were a smaller group with circumstances that led them to take larger loans. Fewer students borrow at Princeton than almost anywhere, and the ones who graduate with debt still leave with far less than the national average.
Where the competition between fields actually lives
Princeton does not admit by major, and that changes what competition between fields means here. Students apply to the university, not to a department. Once enrolled, they pursue either the Bachelor of Arts, the A.B., or the Bachelor of Science in Engineering, the B.S.E., and then declare one of 37 concentrations, in most cases at the end of sophomore year. There is no direct-admit computer science track that gates entry the way some public universities run one. The closest thing to a major-level signal on the application is the A.B. or B.S.E. choice itself, since B.S.E. applicants are read with attention to math and science preparation.
The mix of degrees conferred still shifts year to year, and Section J of the Common Data Set tracks it. The figures below show each field’s share of bachelor’s degrees, by the year the degrees were awarded.
| Field (share of degrees) | 2020–21 | 2021–22 | 2022–23 | 2023–24 | 2024–25 |
| Social sciences | 20% | 20% | 19.7% | 19.5% | 20% |
| Engineering | 16% | 18% | 16.4% | 17.2% | 18% |
| Computer science | 13% | 14% | 15.7% | 16.1% | 14% |
| Public policy / public affairs | 11% | 10% | 8.9% | 9.8% | 9% |
| Biological sciences | 10% | 10% | 9.0% | 10.0% | 9% |
| Physical sciences | 6% | 6% | 6.1% | 4.8% | 6% |
| History | 5% | 5% | 5.5% | 4.2% | 6% |
Source: Princeton University Common Data Sets, Section J, 2021–22 through 2025–26. Percentages use majors rather than headcount, so double majors are counted in each field.
Degree share by field, 2020-21 to 2024-25
Degree share by field, 2020–21 to 2024–25. Source: Princeton University Common Data Sets, Section J.
Social sciences, the bucket that holds economics along with politics, sociology, and anthropology, is the largest field at Princeton every year, near 20 percent of degrees. Economics carries much of that weight on its own. Because Princeton has no undergraduate business school, the economics concentration absorbs most of the demand from students headed toward finance and consulting, which makes it one of the most populated and internally competitive paths on campus even though there is no admissions gate to enter it.
The most interesting recent movement is in computer science. Its share of degrees climbed to roughly 16 percent for the classes graduating in 2022–23 and 2023–24, then eased back to 14 percent in the most recent conferral year. Reporting from admissions advisers describes a sharper turn among students who declared more recently: the number choosing the B.S.E. computer science track fell by more than 30 percent from one class to the next, and the A.B. computer science track by more than 40 percent, while history and philosophy picked up. Some of that reflects a national cooling in computer science enrollment after a decade of relentless growth, and some may reflect students reading a tightening entry-level software market. Engineering as a whole moved the other direction, rising toward 18 percent of degrees, led by electrical and computer engineering and by operations research and financial engineering, the concentration that channels much of the quantitative-finance interest.
The practical point is that intended major does not function as a lever at Princeton the way it does at schools with capacity-capped programs. A student cannot game admission by applying to a less popular concentration, because the university is not admitting to concentrations. The one real fork is A.B. versus B.S.E., and a student genuinely drawn to engineering should apply B.S.E. and show the math and science record to back it. Everyone else applies A.B. and sorts into a field later, after arriving.
Transfers: a very narrow door
Princeton reinstated a transfer program in 2018 after decades without one, with an explicit focus on community college students, veterans, and students from lower-income backgrounds. The program has grown on the application side and stayed tiny on the admit side.
| Metric | 2021–22 | 2022–23 | 2023–24 | 2024–25 |
| Transfer applicants | 1,350 | 1,201 | 1,588 | 1,985 |
| Transfer admits | 18 | 35 | 49 | 38 |
| Transfer enrolled | 14 | 28 | 33 | 36 |
Source: Princeton University Common Data Sets, Section D2, 2021–22 through 2024–25.
Transfer applications rose about 47 percent across these four cycles, to nearly 2,000, while admits stayed in the double digits. That puts the transfer admit rate in the low single digits, comparable to or below the first-year rate, and in some years well below it. For a prospective transfer, Princeton is a long shot worth taking only alongside a realistic list, and the program favors exactly the nontraditional profiles it was rebuilt to serve.
What the five-year record means for applicants
Princeton spent five years doing something most selective universities did not. It added students without loosening selectivity, and it made itself dramatically cheaper for middle- and lower-income families at the same time. The admissions outputs, an admit rate near 4.4 percent, a yield in the mid-70s, retention at 99 percent, hold as steady as any in the country. Several specific implications follow.
Treat the waitlist as a soft denial. Princeton admitted 36 students from it for the most recent class and zero in the expansion year. A waitlisted student should accept the place, since it costs nothing, then commit elsewhere and move on.
The testing pause is real, and a scoreless file is complete. A student below Princeton’s submitting range should withhold scores rather than skip the school. A student near or above the submitting median should send them.
The essays and the letters decide close cases. Recommendations and character both rate Very Important in Section C7, which means the parts of the file a student cannot manufacture with a test score carry the most weight. Demonstrated interest does nothing, so visits and contact are for the student’s own information rather than for the admissions read.
Run the net price calculator before assuming the school is out of reach. A family under $100,000 in income may pay nothing, and families well into the low six figures often pay a fraction of the sticker. Princeton’s aid is strong enough that cost should rarely be the reason a qualified student does not apply.
Apply as the person you are, not the person you think a given department wants. Intended concentration is not an admissions lever outside the A.B. and B.S.E. split, and the popularity of a field can swing more than a full point of the class from one year to the next, as computer science just showed. Choosing a concentration is a decision made after arriving, among faculty and courses, not a box to optimize on an application.
Princeton did not get easier or harder over these five years. It got bigger and cheaper while staying exactly as hard to enter as it was, which is the rarer accomplishment. The competition for a seat is as intense at 4.4 percent with 5,900 undergraduates as it was at 4.4 percent with 5,300, and what changed underneath that flat rate is a class that grew, an aid program that widened, and a set of fields that quietly reshuffled while the front door stayed the same size.
Related Reading
For cost of attendance, need-based aid, and admissions metrics across hundreds of institutions, see the College Transitions Dataverse. Princeton publishes its own Common Data Sets and annual admission statistics through the Office of Institutional Research and the Office of Admission, and national context is available through the IPEDS data system.
A note on the data. The Common Data Set is a useful instrument and an imperfect one. Schools have some discretion in how they classify categories, the cohorts referenced in different sections do not always line up, and small year-to-year moves can reflect reporting changes rather than real shifts. Two Princeton-specific quirks are worth flagging for anyone working from these filings directly. The university reports its student-to-faculty ratio against a denominator that changed between the 2024–25 and 2025–26 cycles, so the headline ratio should be read with care rather than taken as a jump in class sizes. And the G1 cost section reports forward-looking prices, so the tuition in any single filing describes the year after that filing, not the year on its cover. Every core figure in this report is drawn from Princeton’s own Common Data Sets.