

Consider two applicants to Tulane with identical files. One applies early decision in November and commits to attend if admitted. The other applies in the regular round in January and keeps every option open. For the Fall 2025 entering class, the first faced an admit rate of 58.2 percent. The second was competing inside a pool that Tulane admitted at 14.5 percent overall, and the regular round is harder than that figure suggests because most of the class was already gone.
That gap is the largest between an early and a general admit rate that this series has measured. It is not a few points of advantage. Early decision applicants at Tulane were admitted at roughly four times the university-wide rate, and in four of the five years examined here the early admit rate ran above 58 percent while the overall rate sat in the low teens.
Tulane admitted between 1,156 and 1,258 students through early decision in every one of those years, against entering classes of between 1,838 and 2,027. Because early decision is binding, nearly all of those admits enrol. The share of the class filled in December ranged from 59.6 percent to 68.3 percent and finished at 65.1 percent.
How to read this record
Five filings carry the analysis, covering the entering classes of Fall 2021 through Fall 2025. All five are machine-readable and all five cross-foot: the gender detail in section C1 sums to the filed totals in every year, and where Tulane reports a residency breakdown it sums independently to the same figures.
Two limitations are worth stating. Tulane reported early action application and admit counts in only one of the five filings, so the three-way split between early decision, early action, and regular decision can be measured for a single year rather than traced. And the residency breakdown appears in three filings rather than five, so geographic comparisons run three years deep.
The Fall 2021 column deserves particular care. That cycle produced the largest applicant pool in this record by a wide margin, and it was the peak of a nationwide surge in application volume during the test-optional years. Reading the decline that follows as a collapse in demand mistakes an unusual peak for a normal baseline.
Applications fell, and the admit rate rose to meet them
| 2021-22 | 2022-23 | 2023-24 | 2024-25 | 2025-26 | |
| Entering class | Fall 2021 | Fall 2022 | Fall 2023 | Fall 2024 | Fall 2025 |
| Applications | 45,525 | 31,615 | 27,936 | 32,609 | 32,942 |
| Admitted | 4,385 | 3,621 | 4,077 | 4,558 | 4,763 |
| Admit rate | 9.63% | 11.45% | 14.59% | 13.98% | 14.46% |
| Enrolled | 2,027 | 1,843 | 1,867 | 1,838 | 1,858 |
| Yield | 46.2% | 50.9% | 45.8% | 40.3% | 39.0% |
| First-year retention | 93.9% | n/a | 94.4% | 92.6% | 93.0% |
Source: Tulane University Common Data Set filings, sections C1 and B22, entering classes of Fall 2021 through Fall 2025. Admit rate = admits divided by applications. Yield = enrolled divided by admits. Gender detail cross-foots to the filed totals in all five years. The 2022-23 filing did not report a retention figure in a readable field.
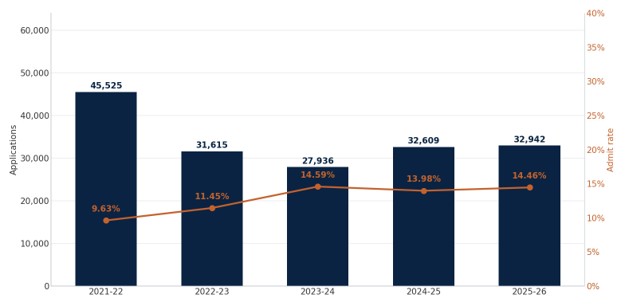
Applications and admit rate, Tulane University, five Common Data Set filings
Applications fell 30.6 percent between the Fall 2021 and Fall 2022 cycles, from 45,525 to 31,615. That is the sharpest single-year decline this series has recorded at any institution. The pool bottomed at 27,936 for Fall 2023 and has since recovered to 32,942, roughly where it sat three years earlier and well below the peak.
The admit rate moved in the opposite direction and has stayed there. Tulane admitted 9.63 percent of applicants for Fall 2021 and 14.46 percent for Fall 2025. A university whose published rate rises by nearly five points in four years looks less selective, and on this measure it is.
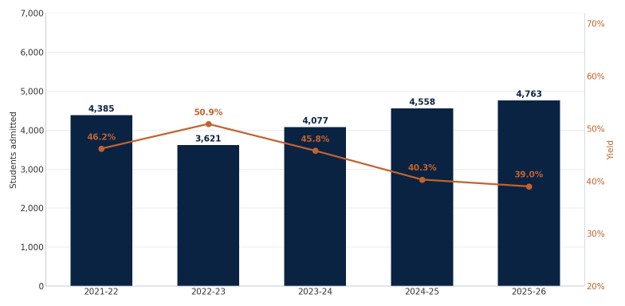
Students admitted and yield rate, Tulane University, five Common Data Set filings
Offers went the other way. Tulane extended 4,385 offers for Fall 2021 and 4,763 for Fall 2025, an increase of 378 against a pool that had shrunk by more than 12,000. The university needed more offers to fill the same class because yield was falling: 46.2 percent, then 50.9, then 45.8, then 40.3, then 39.0 percent. Fewer admitted students said yes each year, and Tulane compensated by admitting more of them.
The entering class itself never moved. Between 1,838 and 2,027 students enrolled in every year, and the last four years sit inside a band of 29 students. Every other number in this table is doing work to hold that one steady.
The early round is the admissions process
| 2021-22 | 2022-23 | 2023-24 | 2024-25 | 2025-26 | |
| Early decision applications | 3,853 | 1,853 | 1,752 | 1,946 | 2,077 |
| Early decision admits | 1,209 | 1,258 | 1,193 | 1,156 | 1,209 |
| Early decision admit rate | 31.4% | 67.9% | 68.1% | 59.4% | 58.2% |
| Overall admit rate | 9.6% | 11.5% | 14.6% | 14.0% | 14.5% |
| ED admits as share of class | 59.6% | 68.3% | 63.9% | 62.9% | 65.1% |
Source: Tulane University Common Data Set filings, sections C1 and C21. Share of class = early decision admits divided by total students enrolled. Early decision is binding, so nearly all admits enrol, though the Common Data Set does not report early decision enrollment separately. Tulane operates two early decision rounds and the filings report them as a combined figure.
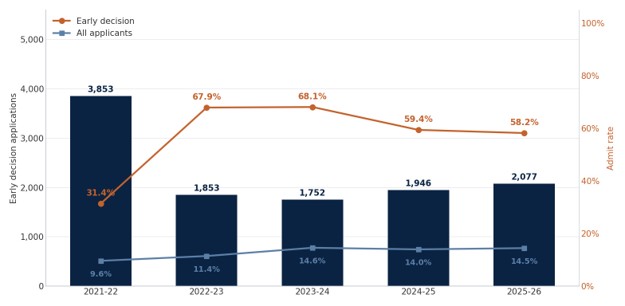
Early decision applications and admit rate against the overall rate, Tulane University
The 2021-22 filing is the outlier and the explanation is a reporting change rather than a change in behaviour. Tulane recorded 3,853 early decision applications that year and between 1,752 and 2,077 in every year since. An early pool that halves and then holds is the signature of a definitional shift in what Tulane counted, and the admit rate jumping from 31.4 to 67.9 percent in a single year points the same way. The four later years are internally consistent and should carry the interpretation.
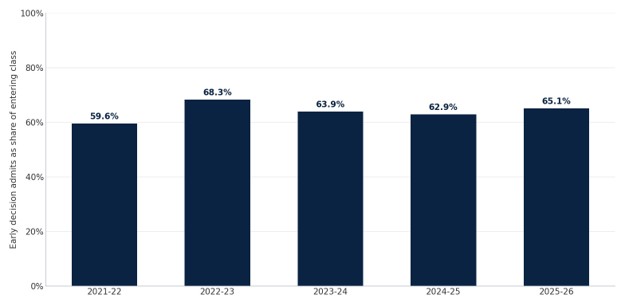
Early decision admits as a share of the entering class, Tulane University
Tulane reported early action figures once, in the 2023-24 filing. That year it received 15,541 early action applications and admitted 2,614, a rate of 16.8 percent. Set against 1,752 early decision applications the same year, the structure becomes clear: early action carries the volume and early decision carries the class. Nearly nine of every ten early applicants that year chose the non-binding round, and the binding round produced two thirds of the students who actually enrolled.
A regular decision applicant is therefore competing for a much smaller remainder than the published rate implies. With roughly 1,200 seats committed in December out of a class near 1,860, the regular round is filling something closer to a third of the class from the overwhelming majority of the applications.
Demonstrated interest is rated, and rated highly
| Admission factor | 2021-22 | 2022-23 | 2023-24 | 2024-25 | 2025-26 |
| Rigor of secondary school record | Very important | Very important | Very important | Very important | Very important |
| Standardized test scores | Very important | Very important | Important | Important | Important |
| Application essay | Important | Important | Important | Important | Important |
| Character and personal qualities | Important | Important | Important | Important | Important |
| Level of applicant’s interest | Considered | Important | Important | Important | Important |
Source: Tulane University Common Data Set filings, section C7. Ratings for the checkbox-format filings were recovered from the horizontal position of each mark relative to the column headers; the 2023-24 filing reports written ratings directly.
Tulane raised level of applicant’s interest from considered to important in the 2022-23 filing and has kept it there. That rating puts demonstrated interest on the same tier as the application essay and personal qualities, and, since 2023-24, standardized test scores themselves. The two moved toward each other: scores fell from very important to important while interest rose from considered to important. Duke rates interest as merely considered. Harvard rates it as not considered at all. Of the universities examined alongside it, Tulane is the only one that treats whether an applicant seems likely to attend as a meaningful factor in whether to admit them.
Read alongside the early decision figures, that rating stops looking like a curiosity and starts looking like the operating principle. A university with falling yield that fills two thirds of its class through a binding round has every reason to weigh evidence that an applicant will actually come.
Testing, and a class that mostly does not submit
| 2021-22 | 2022-23 | 2023-24 | 2024-25 | 2025-26 | |
| Submitted SAT | 15% (297) | 16% (293) | 14% (262) | 13% (230) | 11% (203) |
| Submitted ACT | 41% (828) | 34% (620) | 31% (573) | 28% (506) | 27% (496) |
Source: Tulane University Common Data Set filings, section C9. Percentages express submitters as a share of the enrolled first-year class; students submitting both tests appear in both rows.
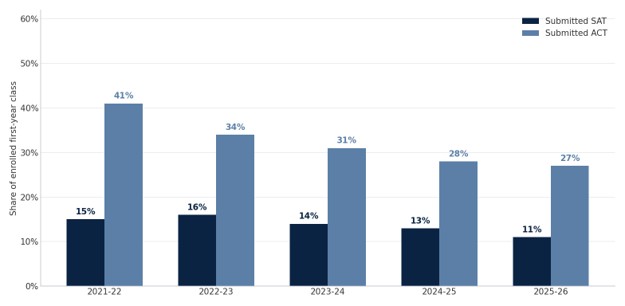
Share of enrolled first-year students submitting each test, Tulane University
Submission fell on both tests in every year. SAT submission dropped from 15 to 11 percent of the enrolled class and ACT submission from 41 to 27 percent. Fewer than four in ten enrolled students submitted either test for Fall 2025, a lower submission rate than any institution examined alongside it. Harvard, which reinstated a requirement, sits at 79 percent on the SAT alone.
Tulane moved test scores down from very important to important over the same period. A university that rates scores no higher than it rates demonstrated interest, and that enrols a class in which most students never submitted a score, has made testing optional in practice as well as in name, which is not true everywhere the label appears.
Where applicants come from
| Applications | Admits | Admit rate | Enrolled | |
| Fall 2023, Louisiana | 1,801 | 436 | 24.2% | 229 |
| Fall 2023, out of state | 23,000 | 3,207 | 13.9% | 1,525 |
| Fall 2023, international | 3,135 | 434 | 13.8% | 113 |
| Fall 2025, Louisiana | 2,676 | 595 | 22.2% | 271 |
| Fall 2025, out of state | 25,512 | 3,593 | 14.1% | 1,489 |
| Fall 2025, international | 4,754 | 575 | 12.1% | 98 |
Source: Tulane University Common Data Set filings 2023-24 and 2025-26, section C1 residency table, reported by known physical address at time of application. The 2021-22 and 2022-23 filings did not collect this breakdown.
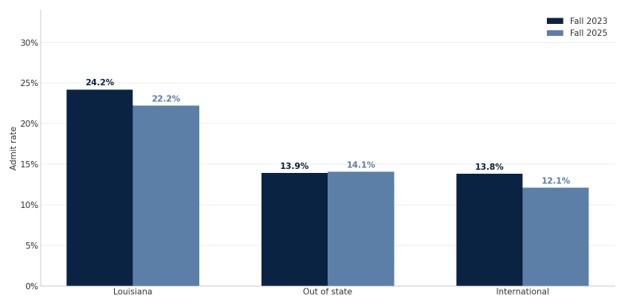
Admit rate by residency category, Tulane University, Fall 2023 and Fall 2025 entering classes
Louisiana residents hold a clear advantage at a private university with no state enrollment obligation. They were admitted at 24.2 percent and then 22.2 percent, against out-of-state rates near 14 percent in both years. Home-state applications also grew faster than any other category, rising 48.6 percent between the two reported cycles.
International applicants moved the other way. Their pool grew by 1,619 applications while offers rose by only 141, pushing the rate from 13.8 down to 12.1 percent, and enrolled international students dropped from 113 to 98. Tulane draws roughly five percent of its class from outside the United States, against 11 percent at Duke and 15 percent at Harvard.
Price and aid
| 2021-22 | 2022-23 | 2023-24 | 2024-25 | 2025-26 | |
| Published tuition | $56,684 | $58,666 | $61,306 | $64,372 | $67,592 |
| Average need-based grant | $40,660 | $43,039 | $47,857 | $54,852 | $64,125 |
Source: Tulane University Common Data Set filings, sections G1 and H2. Grant figures cover full-time first-time first-year aid recipients. Tuition and aid figures cover adjacent rather than identical years, since each filing reports aid for the current year and prices for the following one.
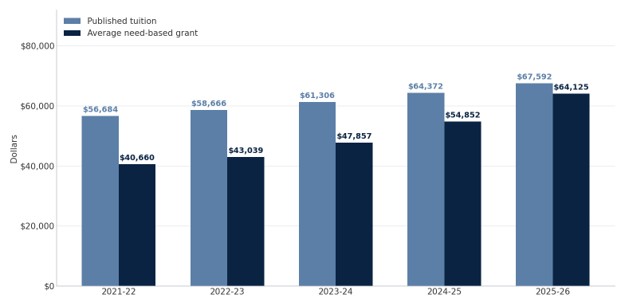
Published tuition against average need-based grant for first-year aid recipients, Tulane University
The average need-based grant to a first-year aid recipient rose 57.7 percent across the five filings, from $40,660 to $64,125. Published tuition rose 19.2 percent across the five filings. Aid grew three times as fast as price, and the most recent average grant now sits within $3,500 of covering tuition outright.
That trajectory is the steepest aid growth in this series, and it arrives during the same period in which yield fell from 50.9 to 39.0 percent. A university losing an increasing share of its admitted students to competitors, and rating demonstrated interest as important while doing so, has an obvious reason to put more money in front of the students it wants.
What Tulane students study
Business and marketing is the largest category of bachelor’s degrees and has grown, from 24.86 percent in the first filing to 27.69 percent in the last. Social sciences ranks second and moved the other way, from 18.34 to 15.70 percent. Psychology rose from 6.41 to 7.77 percent and communication and journalism from 6.17 to 7.73 percent, while biological and life sciences held between 8.15 and 8.77 percent in every year. Computer and information sciences fell from 3.19 to 2.76 percent and engineering from 2.91 to 1.84 percent.
The shape of that distribution separates Tulane sharply from the technical universities in this series. Where engineering, engineering technologies, and computing together account for nearly half of Purdue’s degrees, the same three fields account for under five percent at Tulane. The concentration sits instead in business, the social sciences, psychology, and communication, which is the profile of a liberal arts university with professional schools attached rather than a technical institute.
Tulane admits to Newcomb-Tulane College, the single undergraduate college, rather than to a school or a major. Students choose a major later, and the Common Data Set publishes no admit rate by program. Applicants cannot improve or damage their odds through the field they name.
Scale, and what it looks like in a classroom
Tulane is among the smaller universities in this series. Total enrollment across all levels stood at 13,127 in the first filing and 12,030 in the last, a decline of 1,097 students. Undergraduate enrollment fell over the same period, from 7,780 to 6,839, which leaves it close to Duke’s 6,525 and near one sixth of Purdue’s.
Undergraduate class sections fell from 1,670 in Fall 2021 to 1,543 in Fall 2025. Sections enrolling fewer than 20 students accounted for 60.9 percent of the total in the first year and 62.0 percent in the last, so the small-section share held steady while the overall count contracted. Sections of 100 or more students fell from 27 to 20, which is fewer very large classes than any other institution examined here.
The reported student-to-faculty ratio was 8 to 1 in the first filing. Read against the section distribution, that describes a university where roughly three of every five undergraduate sections enrol under twenty students and very large lectures are rare.
Retention held between 92.6 and 94.4 percent in the four filings that reported it, moving less than two points across the period and showing no relationship to the swings in application volume above it. Whatever changed in Tulane’s applicant pool between Fall 2021 and Fall 2025, the students who enrolled stayed at close to the same rate throughout.
Beyond the numbers
The application decline that opens this record needs context the Common Data Set does not supply. The Fall 2021 cycle sat at the top of a national surge in application volume driven by widespread test-optional policies and free applications, and Tulane drew an unusually large pool relative to its class size even by the standards of that year. Volume at many selective private universities receded afterward. What distinguishes Tulane is the size of the drop and the fact that the pool has not returned to its peak.
The waiting list is the piece of the funnel most applicants misread. Tulane offered between 4,062 and 6,232 applicants a place on its list in every year of this record, and between 1,871 and 3,158 accepted one. In the single year the filings report an outcome, Fall 2024, Tulane admitted 432 students from a list 2,290 people had joined. With a binding early round filling two thirds of the class and yield falling, the list functions as the university’s margin of error rather than as a second chance.
One structural point deserves emphasis for anyone comparing Tulane to the rest of this series. Duke fills roughly 60 percent of its class through early decision and rates level of interest as considered. Harvard runs non-binding early action and rates interest as not considered. Purdue runs non-binding early action and admits by major. Tulane runs two binding early rounds plus early action, fills about two thirds of its class in December, and tells applicants in writing that it weighs how interested they appear. No other institution in this group is as explicit about the mechanics.
What the five-year record means for applicants
Apply early decision or accept a materially worse position. The early rate has run between 58 and 68 percent in four consecutive filings against an overall rate near 14 percent, and roughly two thirds of the class is committed before regular applications are read. An applicant who would attend Tulane over any other option, and whose family can commit without comparing aid offers, is giving away the largest single advantage in this series by waiting.
Applicants who need to compare aid packages should not apply early decision, and should understand what that costs. Tulane’s average need-based grant has grown 57.7 percent in five years, which makes the aid worth comparing, but the binding round is where the odds are.
Demonstrate interest, and treat it as a rated component rather than a courtesy. Tulane has rated level of applicant’s interest as important in four consecutive filings, the same tier it now assigns to test scores. Campus visits, substantive contact, and a supplemental essay that could not have been written for another university are being read as evidence, not as enthusiasm.
Test scores are genuinely optional. Fewer than four in ten enrolled students submitted either exam for Fall 2025, submission has fallen every year, and Tulane rates scores below demonstrated interest. A strong score still helps and should be sent. A weak one can be withheld without the quiet penalty that applies at universities where most of the class submits.
Finally, read the rising admit rate correctly. Tulane is not becoming easy. Its rate rose because a very large pool receded from an unusual peak while the class stayed the same size, and the regular round remains harder than the published figure because most of the seats are already taken.

