
For the Fall 2021 entering class, 40,878 students applied to the University of Virginia. For Fall 2025, that number reached 64,457. One cycle later, for the Class of 2030, it crossed 82,000. In four years the applicant pool grew by more than half, and the overall admit rate fell from roughly 23 percent to under 16 percent. UVA did not enlarge its class to match. It still enrolls a first-year group of about 3,900 to 4,000 students, close to two-thirds of them Virginians. The result is an admissions operation absorbing a national surge in demand while holding to a state mandate that shapes almost everything about how the class gets built.
That mandate is the single most important fact about applying to UVA, and it separates the school from the private universities it is often measured against. As a public flagship, UVA is expected to keep about two-thirds of each entering class made up of Virginia residents. Every headline number, the overall admit rate, the yield, the test profile, reads differently once it is split by residency. An out-of-state applicant and an in-state applicant are effectively moving through two different admissions processes, with two different acceptance rates, and the gap between them has widened as applications have climbed.
This report covers five entering classes, Fall 2021 through Fall 2025, drawing on UVA’s Common Data Set filings and the university’s published admission statistics, along with reporting on the cycles that followed. It walks through selectivity and the residency split, the three-round application system and the edge early applicants get, UVA’s decision to stay test-optional while much of its peer group reversed, what the published admission factors reveal, the competition among UVA’s undergraduate schools, and the cost and aid picture. It closes with what the record suggests for applicants and the people advising them.
Application volume and selectivity
UVA received 64,457 first-year applications for the Fall 2025 entering class, up from 40,878 four years earlier. The admit rate compressed in step, from 22.6 percent for the Class of 2025 to 15.6 percent for the Class of 2029. The entering class held near 3,950 to 4,000 across the window, and yield, the share of admitted students who enroll, has stayed around 40 percent, a strong figure for a public university and close to what UCLA, Michigan, and UNC-Chapel Hill report.
| Metric | 2021-22 | 2022-23 | 2023-24 | 2024-25 | 2025-26 |
| Applications | 40,878 | 47,982 | 56,528 | 58,951 | 64,457 |
| Admits | 9,230 | 9,951 | 9,533 | 9,909 | 10,086 |
| Admit rate | 22.6% | 20.7% | 16.9% | 16.8% | 15.6% |
Source: University of Virginia Common Data Sets, Section C1, Fall 2021 through Fall 2025 entering classes (Classes of 2025 through 2029). Application and admit totals for the earlier cycles are as compiled by College Transitions from UVA’s CDS filings.
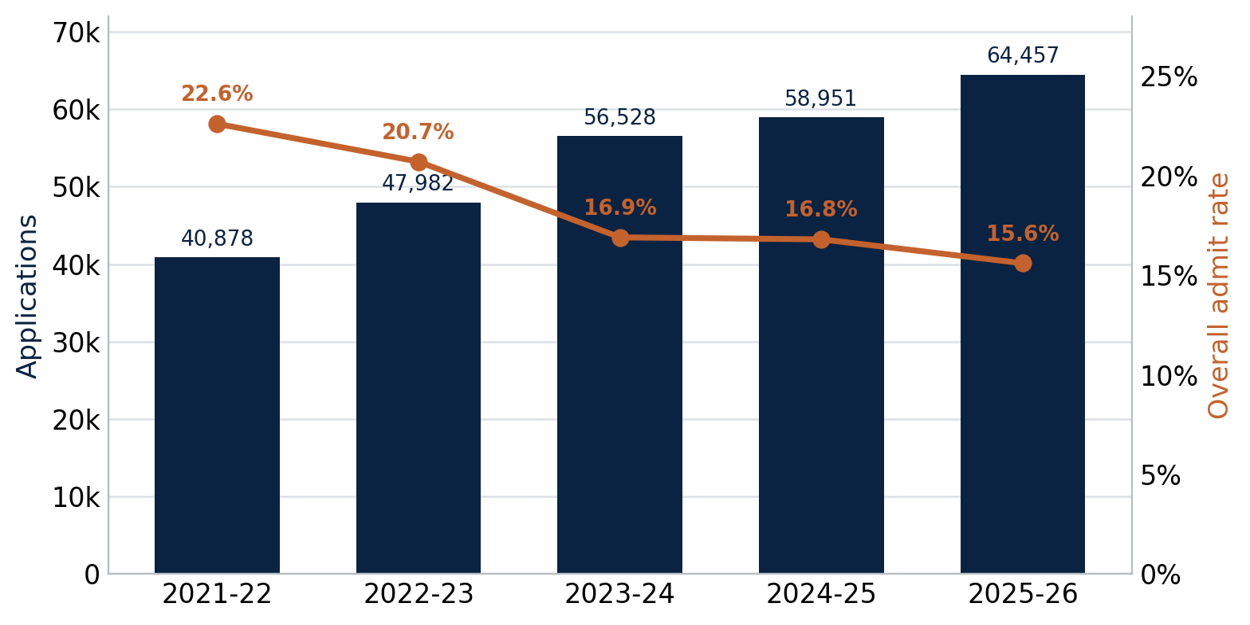
Applications and overall admit rate, Fall 2021 to Fall 2025. Source: University of Virginia Common Data Sets, Section C1.
Two features of the data stand out. The compression in the admit rate is volume-driven rather than the product of a shrinking class. UVA has admitted a fairly steady 9,200 to 10,100 students each year and enrolled a class of roughly the same size throughout, so the falling rate reflects a denominator that keeps growing. The steepest single-year move came between the Classes of 2026 and 2027, when applications jumped from about 48,000 to more than 56,000 and the admit rate dropped nearly four points in one cycle. The two most recent filings show 3,961 students enrolled for Fall 2024 and 3,976 for Fall 2025, both near a 40 percent yield.
The trend did not stop at the edge of this window. For the Class of 2030, the cycle that closed in spring 2026, UVA reported 82,118 applications, a 27 percent jump in a single year and the largest such increase in the university’s history. It admitted 10,287 students, pushing the overall rate to 12.5 percent. Anyone reading the five-year table should treat 15.6 percent as the recent floor rather than the current reality; the number the next CDS records will be lower.
The in-state advantage
UVA’s overall admit rate is close to meaningless for an individual applicant until it is separated by residency. Because the university aims to seat about two-thirds Virginians, it admits state residents at roughly twice the rate of everyone else, and the two figures have diverged as the pool has grown.
| Admit rate by residency | Class of 2026 | Class of 2027 | Class of 2028 | Class of 2029 |
| In-state | 27.6% | 27.6% | 25.9% | 23.6% |
| Out-of-state (incl. international) | 15.2% | 13.2% | 13.8% | 12.7% |
Source: University of Virginia admission statistics and Common Data Set, Section C, Classes of 2026 through 2029. Out-of-state figures include international applicants.
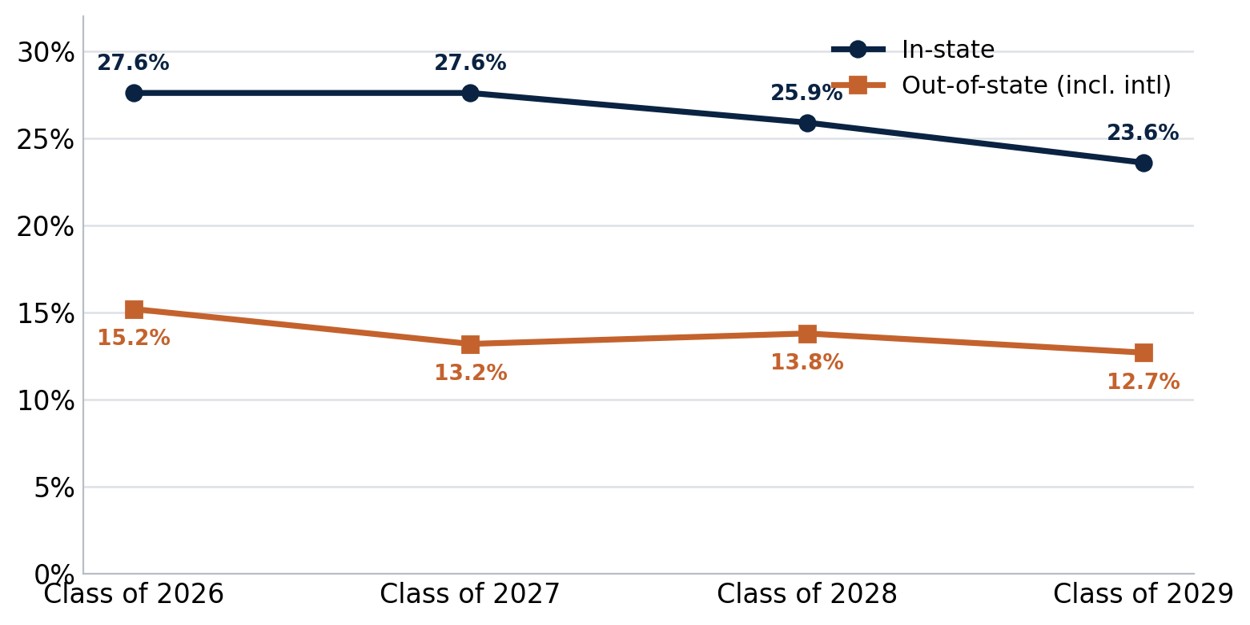
Admit rate by residency, Classes of 2026 to 2029. Source: University of Virginia admission statistics.
The pattern held into the next cycle and sharpened. For the Class of 2030, Virginians were admitted at about 22 percent while out-of-state applicants faced a 10 percent rate, and out-of-state Regular Decision applicants succeeded less than 7 percent of the time. On the enrolled side, the Fall 2025 class broke down to 2,529 in-state students and 1,447 from out of state and abroad, or about 64 percent Virginian, with international students making up roughly 4 percent. For a family in Fairfax or Richmond, UVA is a selective but realistic target for a strong student. For a family in California or New Jersey, it is a reach that behaves more like a private university admitting in the low teens, and one where the bar on scores and rigor sits higher because the in-state seats are spoken for.
Three application rounds and the early edge
UVA is one of a small number of highly selective universities that runs three distinct application rounds: binding Early Decision, non-binding Early Action, and Regular Decision. The university dropped Early Decision in 2007, then brought it back for the Class of 2024, and the binding option has since become a meaningful lever. Across the past several cycles, the ED admit rate has run near 24 to 30 percent, Early Action near 12 to 16 percent, and Regular Decision closer to 7 percent.
For the Class of 2029, ED applicants were admitted at roughly 27 percent (about 30 percent in-state and 21 percent out-of-state), while EA ran near 16 percent overall. The rounds are not equally sized. Early Action has become the dominant path by volume, drawing tens of thousands of applications, and it is where the recent surge concentrated: for the Class of 2030, EA submissions rose 37 percent in one year. Regular Decision, by contrast, has turned into the hardest round, since Early Decision and Early Action fill a large share of the class before the regular pool is read.
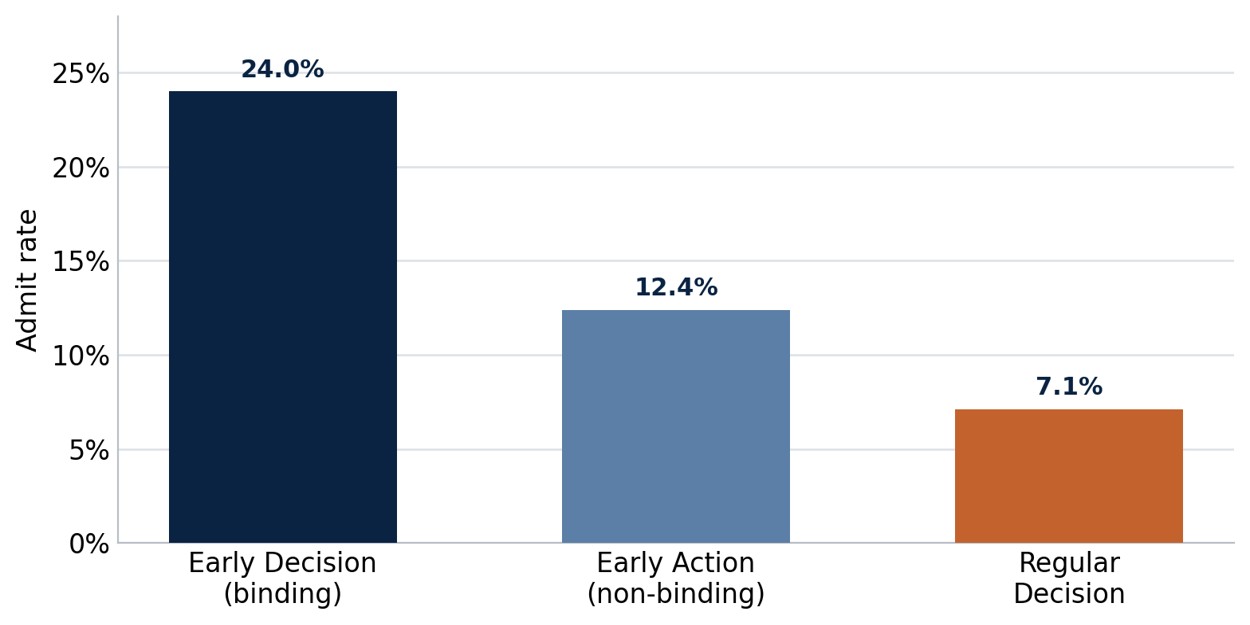
Admit rate by application round, Class of 2030 (Fall 2026 cycle). Source: UVA admission data via The Cavalier Daily, March 2026.
Two practical points follow. Early Decision offers a real statistical edge and suits a student for whom UVA is the clear first choice and whose application is at its strongest by the November deadline. Early Action offers a smaller edge and, more valuably, an earlier answer without a binding commitment, which makes it the natural round for a strong out-of-state applicant who wants to keep options open. UVA does not consider demonstrated interest and does not interview, so campus visits, emails to the office, and similar gestures carry no weight in the decision. What counts is the file.
Testing: optional while the peer group reversed
UVA went test-optional for the Fall 2021 cycle and has kept that policy in place through the Fall 2026 cycle, with its filings indicating the same posture for Fall 2027 applicants. That steadiness is now the exception among schools of its caliber. Over the same period, Caltech, MIT, Harvard, Yale, Brown, Dartmouth, Cornell, Georgetown, and a growing list of public flagships including the University of Texas reinstated a testing requirement, joined more recently by Auburn, Alabama, and LSU. UVA held its ground.
Among enrolled first-years in Fall 2025, about 60 percent submitted a score, split between 48.7 percent who sent the SAT and 14.5 percent who sent the ACT. For the most recent class with a published profile, the middle 50 percent ran from 1410 to 1520 on the SAT and 32 to 35 on the ACT. UVA superscores the SAT, combining the best section results across sittings, but does not superscore the ACT. In the C7 factor grid, standardized test scores are rated Considered rather than Very Important, which is consistent with a genuinely optional policy, though the submitted scores still concentrate near the top of the national distribution.
For an applicant, the arithmetic is simple. A little over half the class submits scores, so a score at or above the middle 50 percent strengthens a file and a score below it is better left off. A student sitting comfortably above 1500, or 34, has a straightforward case for submitting. A student well under the range gains little by including it and loses nothing by applying without it.
What the file has to show: the C7 factors
Section C7 of the Common Data Set is where UVA states, in its own reporting, what carries weight. The 2025-26 filing rates five factors as Very Important: rigor of the secondary school record, class rank, academic GPA, character and personal qualities, and state residency. Application essays, recommendations, extracurricular activities, and talent or ability are rated Important. Test scores, first-generation status, geographic residence, volunteer work, and work experience are Considered. Interviews and level of applicant’s interest are Not Considered.
Two things are worth drawing out. State residency appearing among the Very Important factors is unusual, and it is the CDS making explicit what the two-thirds rule requires: where an applicant lives is not a tiebreaker but a central term in the decision. And the academic profile behind these ratings is compressed at the top. Among enrolled first-years in the most recent class with published figures, about 90 percent carried a weighted GPA of 4.0 or higher, roughly 84 percent ranked in the top tenth of their high school class, and about 97 percent placed in the top quarter. A file that is merely very good academically is common in this pool; the transcript is the largest piece of the puzzle, and UVA’s readers say plainly that they read every application front to back with no numeric cutoffs.
One factor on that grid now sits at odds with state law. UVA’s CDS still lists alumni relation as Considered, but a Virginia statute signed in March 2024 and effective that July bars public universities in the Commonwealth from giving any admissions preference based on legacy or donor connections. Virginia was the first state to enact such a ban after the Supreme Court’s 2023 decision ending race-conscious admissions, and the second overall after Colorado. UVA had already removed the legacy checkbox from its application in 2023. The change is not cosmetic: the university had reported that children of alumni made up close to 15 percent of some recent classes. For applicants with a UVA family history, that door-opening advantage is now closed by law, and the lingering CDS entry reflects reporting lag rather than current practice.
Where the competition actually lives
UVA admits first-year students to a specific school or program, and those units do not compete on equal terms. The College of Arts and Sciences is by far the largest point of entry. The School of Engineering and Applied Science runs its own admission and is generally more selective than the College. The School of Architecture, the School of Nursing, and the Department of Kinesiology admit smaller, more specialized cohorts. The scale of the split shows up in the Early Action offers for the Class of 2030, which went out to about 5,261 applicants for Arts and Sciences, 1,604 for Engineering, 133 for Architecture, 81 for Nursing, and 72 for Kinesiology.
Business is the case that trips up the most families, because there is no way to enter it directly. The McIntire School of Commerce is an upper-division school that does not offer first-year or preferred admission. Students who want the B.S. in Commerce apply to UVA through the College of Arts and Sciences, complete a set of prerequisites, and then submit a separate, competitive internal application. Beginning with the 2024-2025 academic year, McIntire moved to a three-year curriculum, and first-year students now apply at the end of their spring semester, with the application opening in March and decisions released in June, for entry the following fall. A student aiming at McIntire therefore clears two gates: admission to a selective public university, then a competitive internal review a year later. McIntire also carries a tuition differential above the standard UVA rate.
Computer science follows a related logic. It is offered as a B.A. through Arts and Sciences and as a B.S. through Engineering, and demand for it is heavy on both sides, which raises the effective bar for applicants who signal it. The pathways most often described as the toughest at UVA, Commerce, computer science, economics, government and foreign affairs, and the sciences feeding pre-health tracks, are exactly the ones where applicant interest outruns the available seats. For a student, the school and intended major named on the application are strategic choices, not administrative details, and applying to an oversubscribed program with a thin profile is a harder road than the overall admit rate suggests.
Cost, aid, and what families actually pay
UVA’s published costs for 2026-27 separate sharply by residency. In-state tuition is $19,309, and required fees add $3,945, for about $23,254 in tuition and fees. Out-of-state tuition is $59,035, or roughly $62,980 with fees. Food and housing run about $16,070 on campus, with books, transportation, and personal expenses adding several thousand more. Tuition varies by year of study and by program, and about 27 percent of undergraduates pay more than the base figure, a reflection of the McIntire differential and higher charges in certain schools.
The sticker overstates what many families pay. UVA commits to meeting 100 percent of demonstrated financial need through its AccessUVA program, using its own institutional methodology, and it extends institutional aid to out-of-state students as well as Virginians. In the most recent CDS filing, the average need-based grant for aided undergraduates was about $35,690 and the average total package about $38,880, with need fully met for recipients. For lower-income Virginia families, the program is more generous still: households below roughly $50,000 in income, with typical assets, can have the full cost of attendance covered, and those below about $100,000 can have tuition and fees covered. UVA requires both the CSS Profile and the FAFSA. U.S. News ranks it the No. 2 best-value public university in the country, and it posts the highest graduation rate for Pell Grant recipients of any public university, at about 92 percent, evidence that the aid reaches students and that they finish.
Retention and graduation
UVA’s persistence numbers are among the strongest in public higher education. First-year retention runs near 97 to 98 percent, and the six-year graduation rate sits around 95 to 96 percent, the highest of any public university in the U.S. News assessment. The most recent CDS cohorts show six-year completion of 90.1 percent for Pell recipients and 95.4 percent for non-recipients in the Fall 2019 group, and 92.0 percent and 95.1 percent in the Fall 2018 group. Four-year completion for the Fall 2019 cohort was about 85.5 percent for Pell students and 91.5 percent for non-Pell students, meaning most UVA students finish on time, not just eventually. The student-faculty ratio is 14 to 1.
The gap between Pell and non-Pell completion, a few percentage points, is narrow by national standards and points to a university that graduates students well across the income range. The one metric where UVA lags its public peers is social mobility, where U.S. News places it well down the list, a function of a relatively small share of Pell-eligible students rather than poor outcomes for the ones it enrolls. That small Pell share is itself partly a product of the demographics of the two-thirds-Virginian class the state requires.
The picture beyond the CDS
Two developments outside the Common Data Set frame the five-year record. The first is the demand surge already described, which turned UVA from a school admitting more than a fifth of applicants at the start of the window into one admitting roughly one in eight by the Class of 2030. Early Action drove most of that growth, and the bulk of the increase came from out-of-state applicants, which means the state’s two-thirds rule now filters a far larger and stronger nonresident pool than it did five years ago. The out-of-state Regular Decision rate below 7 percent is the clearest evidence of the squeeze.
The second is UVA’s standing. In the 2026 U.S. News rankings it placed No. 26 among national universities, tied with UNC-Chapel Hill, and No. 4 among public universities, behind Berkeley, UCLA, and Michigan. It appears on Forbes’s “New Ivies” list. That reputation, paired with a total out-of-state cost still below many private peers and an aid program that meets full need, is a large part of why applications keep climbing. The legacy ban, the steady test-optional policy, and the McIntire restructuring are all live changes layered on top of a school that has grown more selective every year with little institutional effort to slow it.
What the five-year record means for applicants
Three conclusions carry into application strategy, especially for cycles from Fall 2026 onward.
First, residency sets the terms. In-state applicants face admit rates roughly double those of out-of-state applicants, and the gap is widening as the nonresident pool grows. Virginians should treat UVA as a selective but attainable target with a strong transcript and rigorous coursework. Out-of-state and international applicants should treat it as a reach that rewards top scores, demanding course loads, and a distinctive profile, and should build a college list that does not lean on UVA as a safety.
Second, the round and the school both shape the odds. Early Decision offers a real edge for a student certain UVA is the first choice; Early Action offers a smaller edge and an early, non-binding answer; Regular Decision is now the hardest path, particularly for nonresidents. And the school named on the application is a strategic decision. A business-minded student should understand that McIntire is a second, internal admission a year after enrolling, and that entry to UVA through Arts and Sciences is only the first step. Engineering and the most popular majors carry their own higher bars.
Third, the file has to do the work, because nothing else will. UVA does not weigh interviews or demonstrated interest, and after the 2024 state law it can no longer weigh legacy. What remains is the transcript, the rigor behind it, the class rank where reported, the character that comes through in essays and recommendations, and, for the majority who submit them, test scores near the top of the national range. For families weighing cost, the guidance is equally direct: run UVA’s net price calculator before ruling it out, since a school with a full-need commitment and the best Pell graduation rate among publics is often more affordable than its out-of-state sticker suggests.