What does it mean when a university’s acceptance rate goes up for three years running? At Villanova, it means the admissions office is working harder to fill a class that has barely changed in size. The rate bottomed at 23.4 percent for Fall 2022 and has climbed every year since, reaching 28.1 percent for Fall 2025. Over the same stretch, yield fell from 31.9 percent to 24.8 percent, which is the arithmetic behind the rise: fewer admitted students are saying yes, so more offers are required to seat the same 1,800 freshmen.
That pattern puts Villanova in an unusual position among selective private universities, most of which spent these five years reporting the opposite trend. It also explains the single largest strategic shift in the file. Binding Early Decision admits filled 43 percent of the entering class in Fall 2021 and 56 percent in Fall 2025. A university that cannot rely on the regular round to convert has leaned on the one round where a yes is guaranteed.
This report covers five entering classes, Fall 2021 through Fall 2025, drawn from Villanova’s Common Data Set filings. It walks through the rising rate and falling yield, the three-round application calendar and the enormous advantage the binding round confers, a testing profile that fewer students submit every year, a demographic composition unlike anything else in this series, the degree mix at a university built around business and engineering, and an aid picture that does not meet full need. It closes with what the record suggests for applicants.
Application volume and selectivity
Applications moved very little across the window, from 24,410 to 25,841, an increase of about 6 percent concentrated entirely in the final year. Admits rose 18 percent over the same period, and the entering class stayed within 65 students of itself.
| Metric | 2021-22 | 2022-23 | 2023-24 | 2024-25 | 2025-26 |
| Applications | 24,410 | 23,835 | 23,127 | 23,256 | 25,841 |
| Admits | 6,162 | 5,576 | 5,810 | 6,274 | 7,272 |
| Admit rate | 25.2% | 23.4% | 25.1% | 27.0% | 28.1% |
| Enrolled | 1,772 | 1,779 | 1,740 | 1,740 | 1,805 |
| Yield | 28.8% | 31.9% | 30.0% | 27.7% | 24.8% |
Source: Villanova University Common Data Sets, Section C1, Fall 2021 through Fall 2025. Admit rate = admits divided by applications. Yield = enrolled divided by admits.
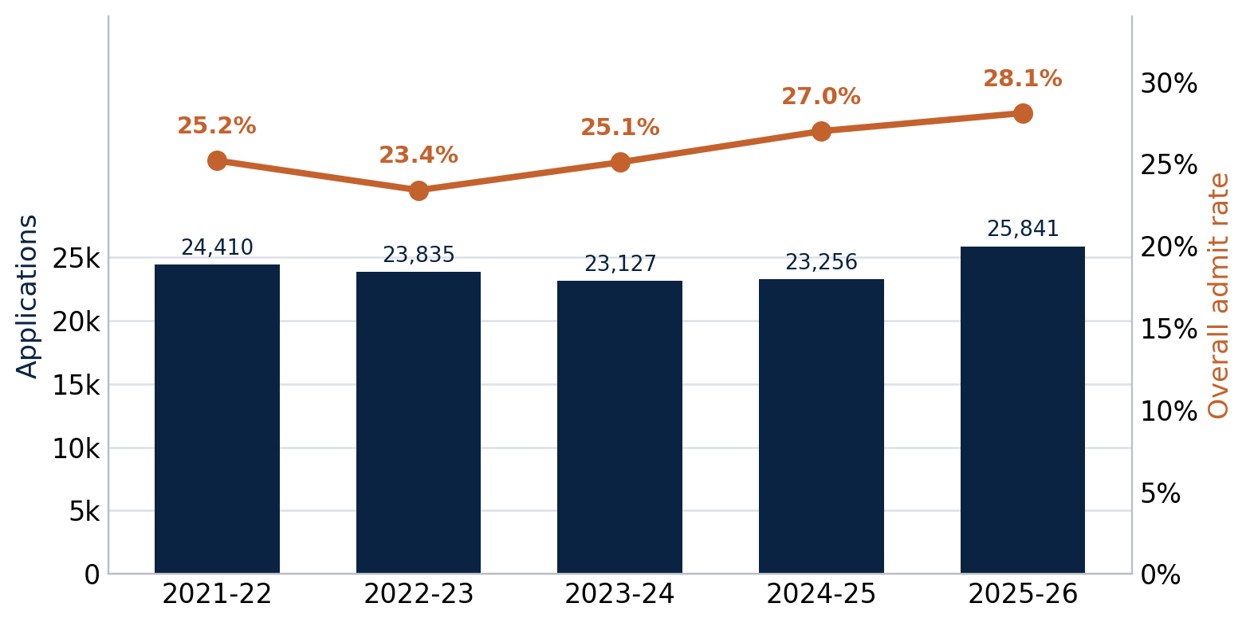
Applications and overall admit rate, Fall 2021 to Fall 2025. Source: Villanova Common Data Sets, Section C1.
The class size is the fixed point. Villanova seats about 1,740 to 1,805 first-year students every year and has not tried to grow, so every movement in the rate reflects a change in how many offers it takes to get there.
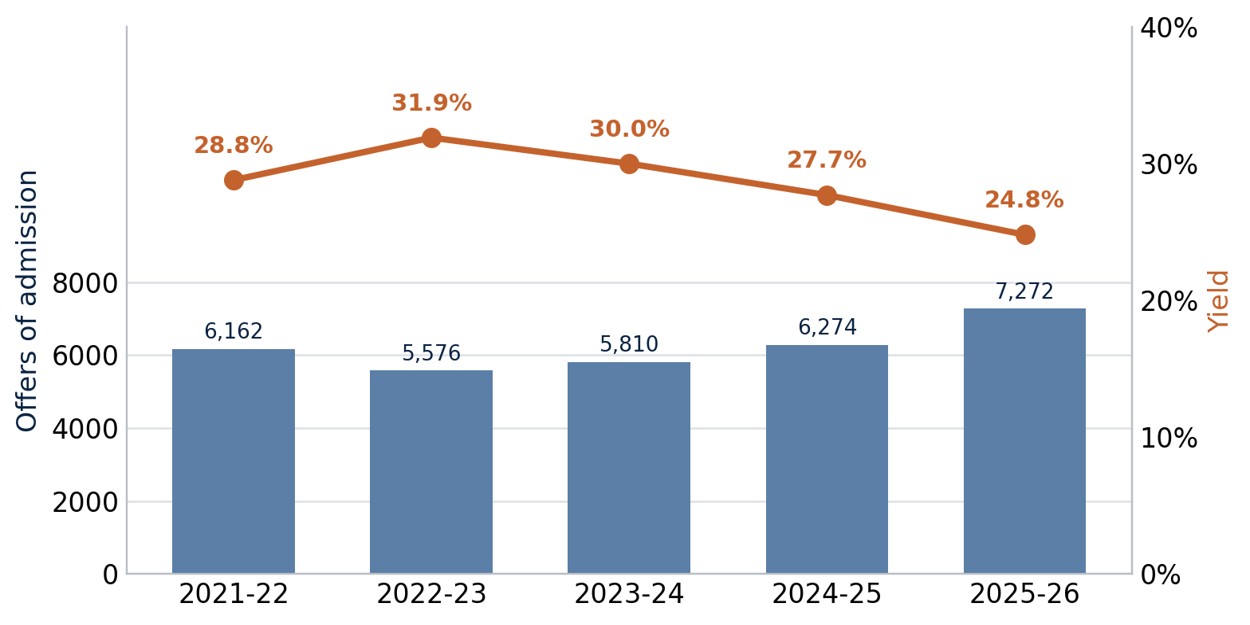
Offers of admission and yield, Fall 2021 to Fall 2025. Source: Villanova Common Data Sets, Section C1.
Yield near 25 percent means three of every four admitted students enroll somewhere else. That is a normal figure for a strong regional private university competing against the Northeast’s dense field of options, and it has drifted downward as the competition for a shrinking pool of college-bound seniors has intensified. The waiting list, meanwhile, has been used erratically: 56 admits in Fall 2021, 36 in Fall 2022, then 873 in Fall 2023, 563 in Fall 2024, and just 28 in Fall 2025. A list that produces 873 admissions one year and 28 three years later is a shock absorber, not a predictable second chance.
The early decision engine
Villanova runs an unusually full menu of application options: binding Early Decision I closing November 1, binding Early Decision II closing January 15, a non-binding Early Action round also closing November 1, and Regular Decision. The gap between the binding round and everything else is the most consequential number in the file.
| Early Decision | 2021-22 | 2022-23 | 2023-24 | 2024-25 | 2025-26 |
| ED applications | 1,288 | 1,467 | 1,657 | 1,696 | 1,680 |
| ED admits | 768 | 815 | 820 | 920 | 1,005 |
| ED admit rate | 59.6% | 55.6% | 49.5% | 54.2% | 59.8% |
| Overall admit rate | 25.2% | 23.4% | 25.1% | 27.0% | 28.1% |
| ED admits as share of class | 43.3% | 45.8% | 47.1% | 52.9% | 55.7% |
Source: Villanova University Common Data Sets, Sections C1 and C21. Share of class = ED admits divided by total enrolled first-year students.
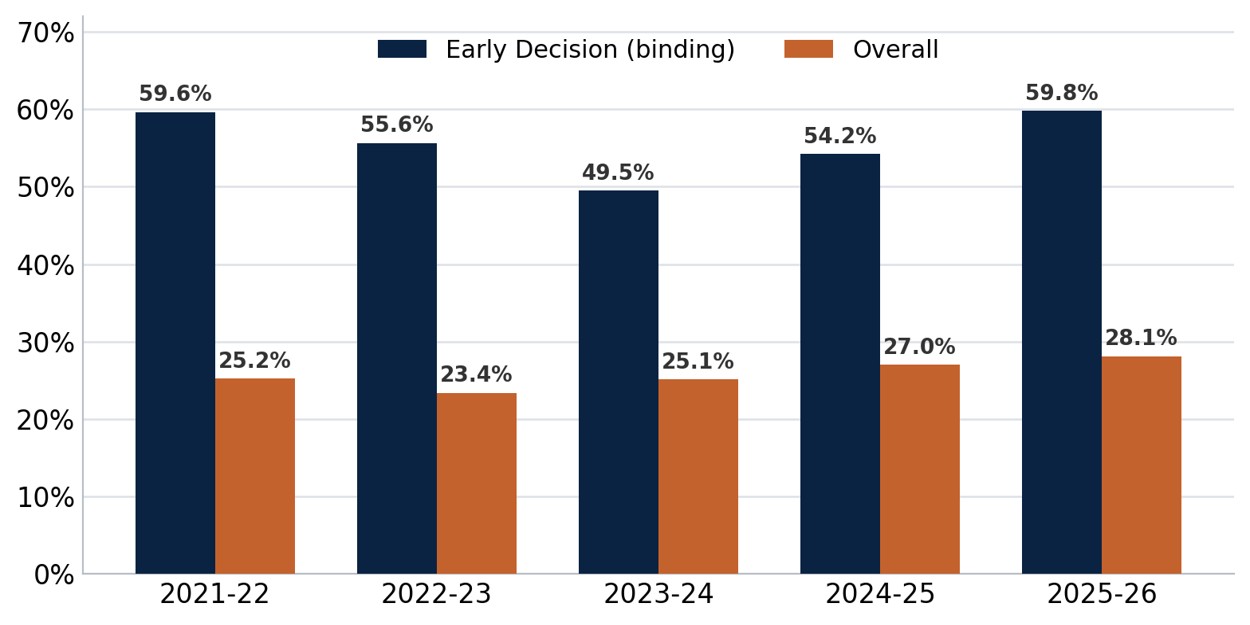
Early Decision admit rate against the overall admit rate, Fall 2021 to Fall 2025. Source: Villanova Common Data Sets, Sections C1 and C21.
For Fall 2025, Villanova admitted 1,005 of 1,680 binding early applicants, a rate of 59.8 percent, against an overall rate of 28.1 percent. An early decision applicant faced odds better than two to one, more than double the general pool. And because the plan is binding, those 1,005 admits translate almost directly into enrolled students, which is why they account for 56 percent of a class of 1,805.
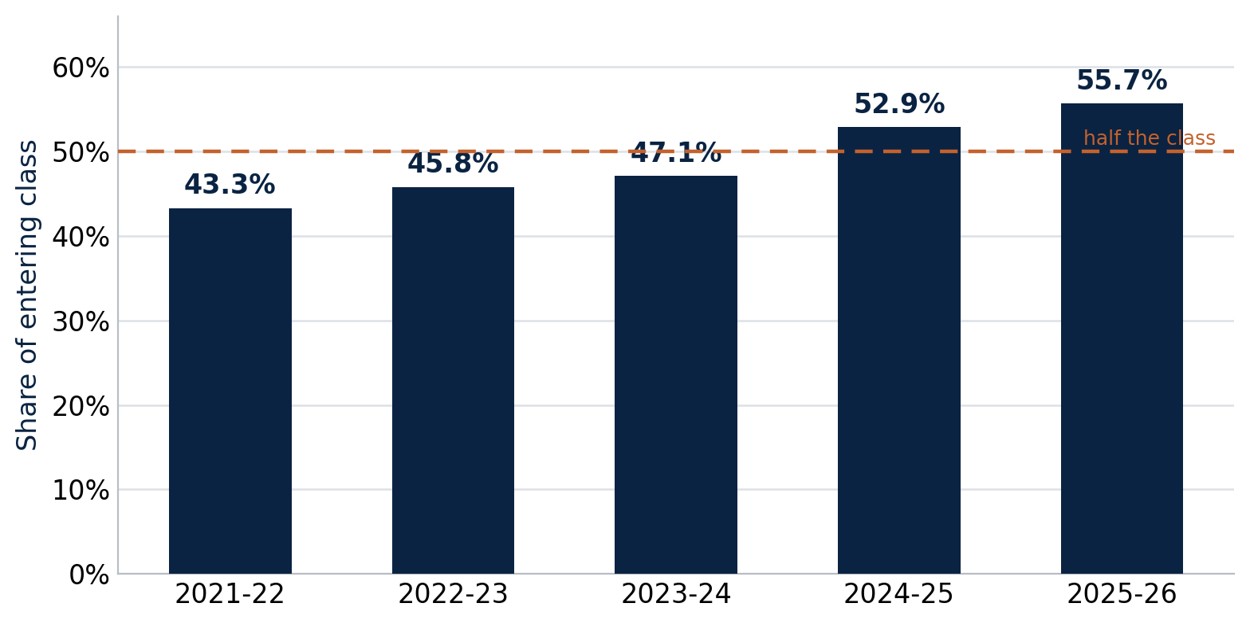
Share of the entering class filled by binding Early Decision admits. Source: Villanova Common Data Sets, Sections C1 and C21.
The one year Villanova reported Early Action counts sharpens the contrast. For Fall 2023 it received 14,667 early action applications, nearly two-thirds of its entire pool, and admitted 2,266 of them, a rate of 15.4 percent. In the same cycle the binding round admitted at 49.5 percent. Applying early at Villanova helps enormously if the application is binding and appears to help not at all if it is not. That is the single most actionable fact in this data set, and it deserves the caution that goes with it: Early Decision commits a family to a price before comparing offers, and Villanova, as the aid section shows, does not promise to meet full need.
What the file rewards
Section C7 places rigor of the secondary school record and academic grade point average at the top in every readable year. The application essay moved up from important to very important in the most recent filings. Recommendations, extracurricular activities, talent, character, and volunteer work are rated important. Class rank, first-generation status, alumni relation, geographic residence, state residency, and work experience are considered. Interviews and religious affiliation are not considered, which is worth noting at a university with a strong Augustinian Catholic identity: faith commitment does not enter the admission decision.
Standardized test scores sit in the considered column, a notch below where most test-optional peers place them. Two entries have moved. A row for racial and ethnic status appeared in the 2021-22 and 2022-23 filings and was gone by 2024-25, following the Supreme Court’s 2023 decision. And level of applicant’s interest, rated considered in the 2023-24 filing, was reclassified as not considered the following year, which formally removes demonstrated interest from the equation.
Testing: optional, and less used every year
Villanova is test-optional, with scores required only of homeschooled applicants. The share of enrolled students submitting anything has fallen steadily, and the reported range has crept upward as the submitting group has become more self-selected.
| Metric (enrolled first-years) | 2021-22 | 2022-23 | 2023-24 | 2024-25 | 2025-26 |
| Submitting SAT | 28% | 28% | 25% | 19% | 19% |
| Submitting ACT | 17% | 15% | 11% | 9% | 9% |
| SAT 25th-75th | not reported | 1390-1480 | 1410-1490 | 1410-1490 | 1420-1490 |
| ACT 25th-75th | 31-34 | 32-34 | 32-34 | 32-34 | 32-34 |
Source: Villanova University Common Data Sets, Section C9. The 2021-22 filing left the SAT composite row blank while reporting section scores. Some students submit both tests, so the two rates sum above the share submitting any score.
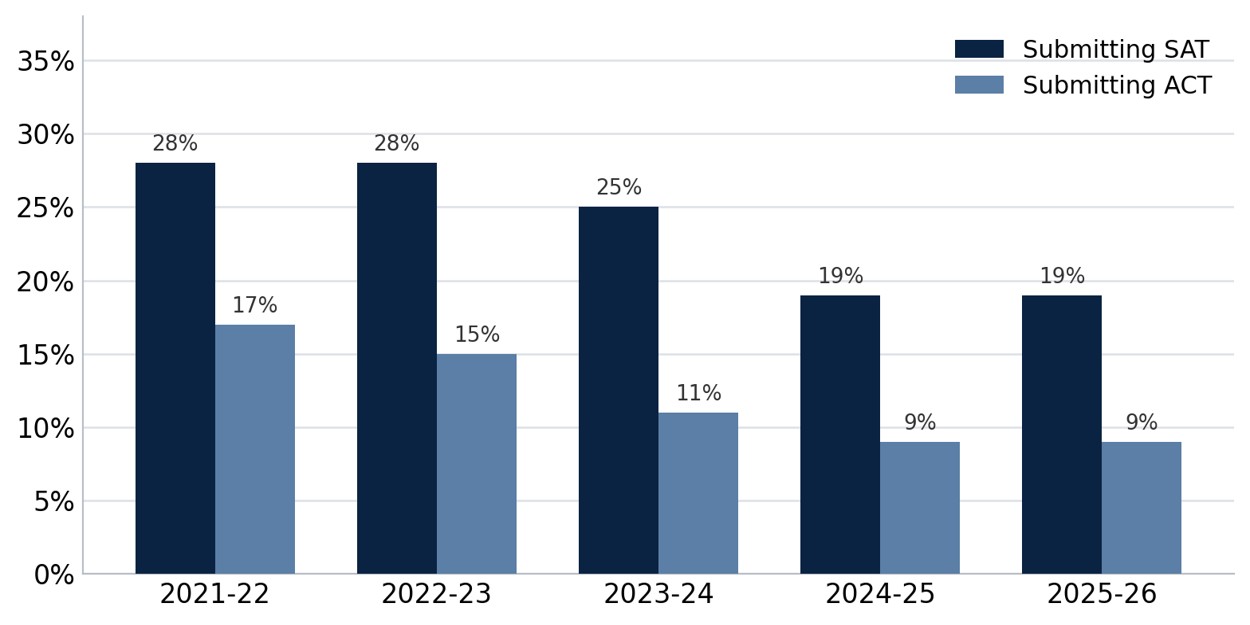
Share of enrolled first-years submitting SAT and ACT scores, Fall 2021 to Fall 2025. Source: Villanova Common Data Sets, Section C9.
Combined submission fell from about 45 percent to 28 percent in four years, one of the steeper declines among test-optional universities. The submitted middle 50 percent on the SAT settled at 1420 to 1490, and 85 percent of submitters scored 1400 or above. With barely a quarter of the class submitting anything, the transcript carries almost the entire academic case, and it is a demanding one: 32 percent of enrolled students reported a 4.0, the average was 3.87, and 81 percent of those who submitted a rank stood in the top tenth of their high school class.
Who enrolls
Villanova’s first-year class is the least racially diverse in this series of reports by a wide margin, and the composition has barely moved.
| First-year share | Fall 2021 | Fall 2022 | Fall 2023 | Fall 2024 | Fall 2025 |
| White | 68.7% | 66.0% | 70.5% | 68.6% | 69.5% |
| Hispanic/Latino | 11.1% | 12.7% | 10.4% | 11.8% | 11.8% |
| Asian | 6.5% | 7.8% | 7.0% | 5.7% | 5.8% |
| Black/African American | 6.3% | 5.7% | 5.1% | 5.9% | 3.4% |
| International | 1.7% | 2.0% | 2.0% | 1.4% | 2.2% |
Source: Villanova University Common Data Sets, Section B2, first-time first-year cohort. Under federal reporting guidelines, Hispanic, multiracial, and international students are counted separately rather than within a single race.
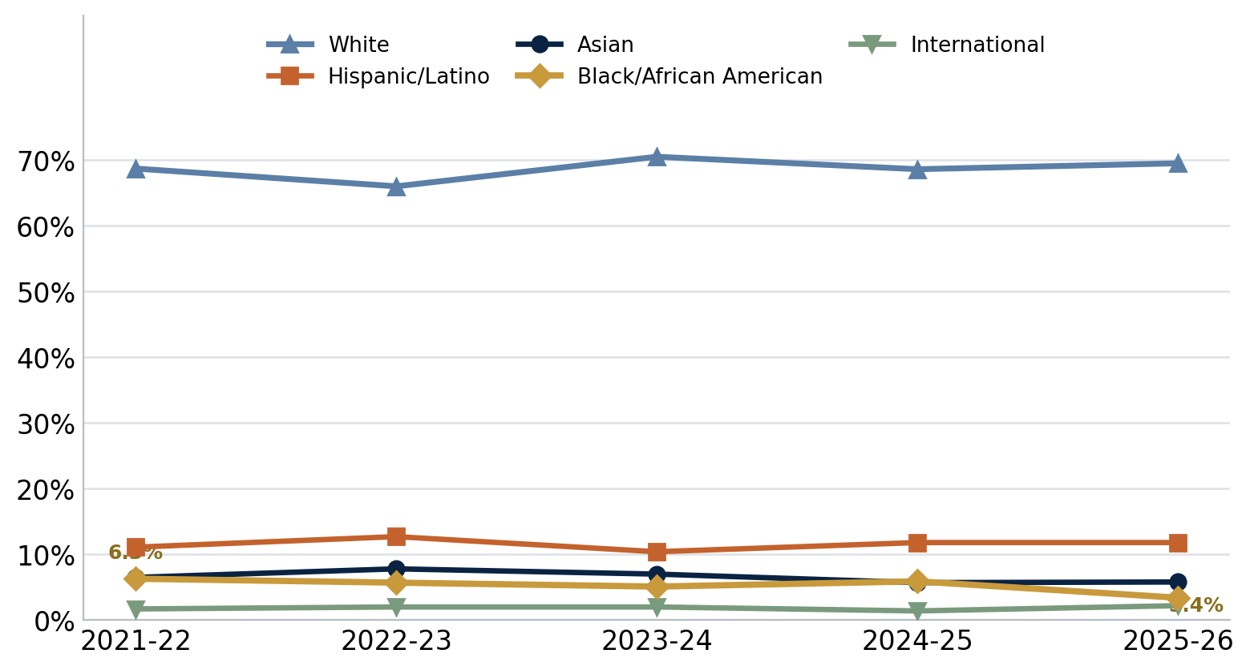
First-year class composition, Fall 2021 to Fall 2025. Source: Villanova Common Data Sets, Section B2.
White students have made up roughly two-thirds to 70 percent of every entering class in the window. The Black share declined from 6.3 percent to 3.4 percent, with the sharpest drop coming in the most recent year, and the international share has hovered near 2 percent, far below the 10 to 20 percent typical of private universities at this selectivity level. Villanova is also strikingly national in geography while narrow in composition: 78 percent of first-year students come from outside Pennsylvania, the highest out-of-state share of any school covered in this series, drawn overwhelmingly from the Northeast corridor. For an applicant weighing fit, these numbers describe the campus more honestly than any brochure.
Where the competition lives
Villanova admits to one of four undergraduate colleges: the College of Liberal Arts and Sciences, the Villanova School of Business, the College of Engineering, and the M. Louise Fitzpatrick College of Nursing. The application asks students to choose, and the degree mix reflects how heavily two of those four dominate.
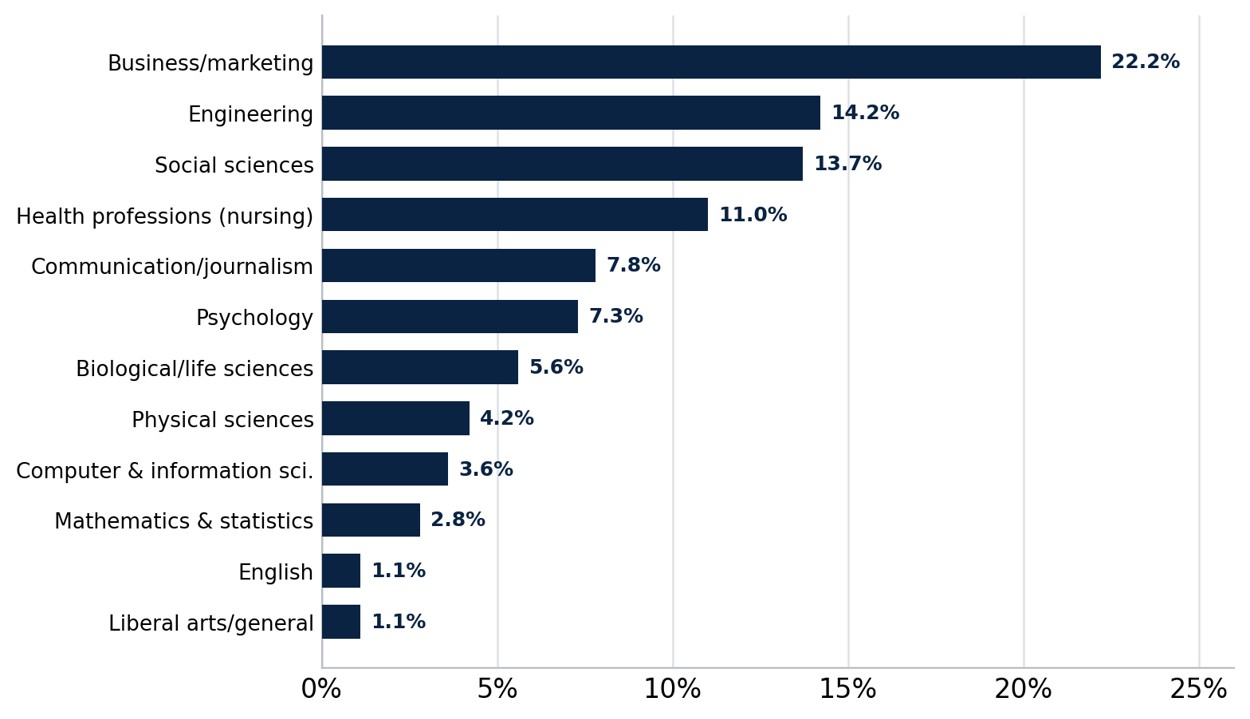
Share of bachelor’s degrees by field, 2024-25. Source: Villanova Common Data Set, Section J.
Business and marketing remains the largest field at 22.2 percent of degrees, followed by engineering at 14.2 percent, social sciences at 13.7 percent, and health professions, essentially nursing, at 11.0 percent. Communication accounts for 7.8 percent and psychology 7.3 percent. Computer science, at 3.6 percent, is notably small for a university of this profile.
The business share deserves a note. It ran between 29 and 31 percent in the first four filings before dropping to 22.2 percent in the most recent one, a one-year move too large to read as a simple trend. Engineering and nursing rose over the same period. What holds across every year is the basic shape: Villanova is a professional-school university with a liberal arts core, and roughly half its degrees come from business, engineering, and nursing combined. Because students apply directly to a college, and because internal transfer into business and nursing is competitive, the choice made on the application shapes the four years more than the university-wide rate suggests.
Cost and an aid gap
Villanova is expensive and, unlike most universities at its selectivity level, does not commit to meeting full demonstrated need. Tuition rose steadily from $60,768 to $72,990 across the five filings, a 20 percent increase, with required fees near $1,024 and food and housing at $19,354 for the most recent year.
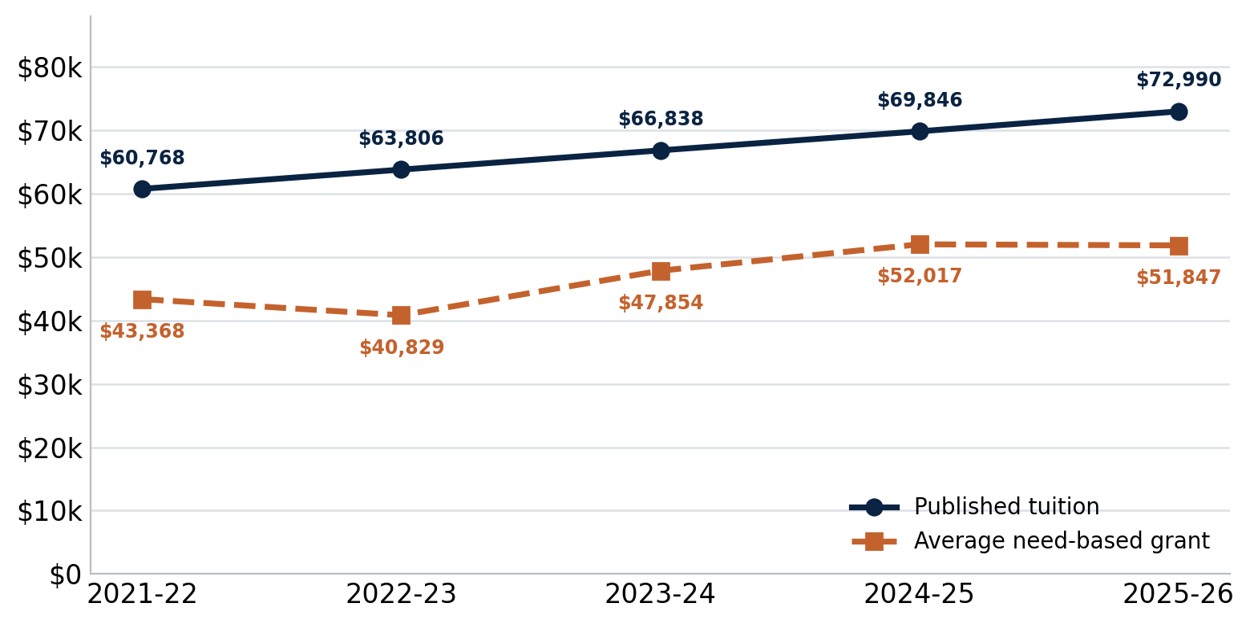
Published tuition against the average need-based grant for first-year students. Source: Villanova Common Data Sets, Sections G1 and H2.
The average need-based grant for first-year students climbed from $43,368 to $51,847, roughly keeping pace with tuition in dollar terms but not closing the gap. The university reports meeting 83.5 percent of demonstrated need on average, up from 80.4 percent but still well short of full need. The sharper figure sits one line below: of the 778 first-year students determined to have financial need in the most recent year, 243 had that need fully met. Fewer than one in three aided students walks away whole.
The borrowing figures follow from that. Forty-five percent of the most recent graduating class borrowed, at an average of $43,841, and 13 percent took private loans averaging $79,603. Both numbers run high against comparably selective private universities, and the private-loan figure in particular is a signal worth taking seriously. Any family considering the binding early round should run the net price calculator first, because Early Decision removes the ability to compare offers at a university that does not guarantee to close the gap.
Retention and graduation
The completion numbers are excellent and stable. First-year retention has held between 95 and 96 percent across the window. The six-year graduation rate for the 2019 entering cohort was 92.7 percent, and four-year completion for the same cohort was 89.4 percent, one of the highest on-time rates at any university in this series.
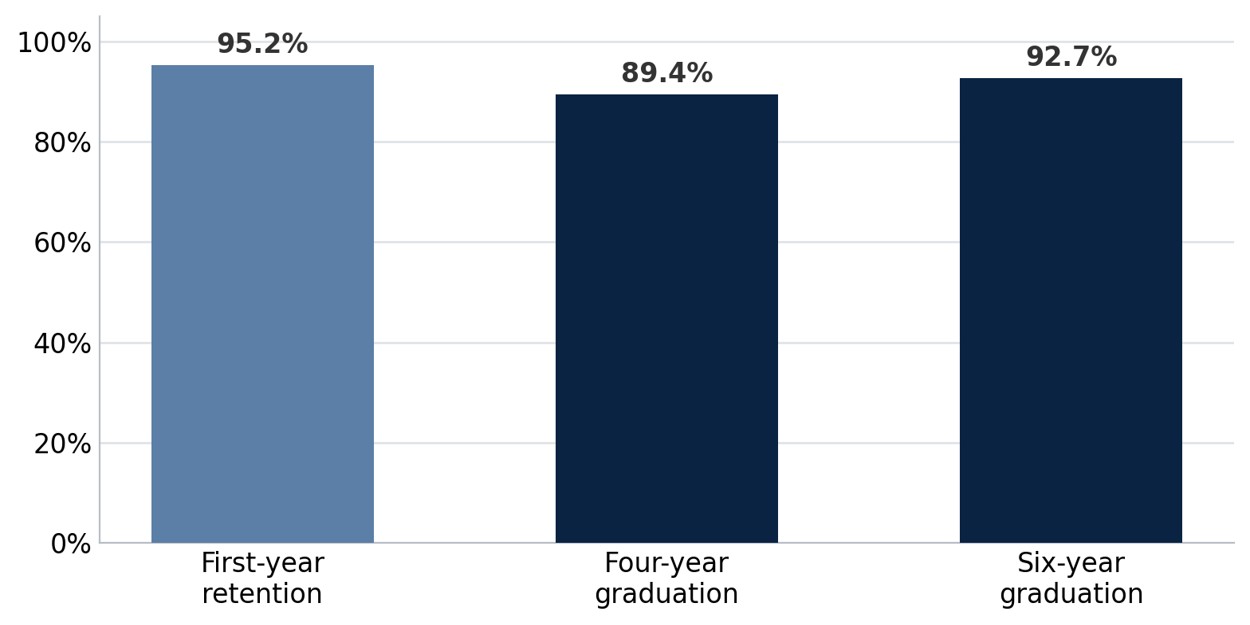
First-year retention and graduation rates, most recent reporting. Source: Villanova Common Data Sets, Sections B4 through B22.
One detail stands out. For the 2019 cohort, Pell recipients graduated at 93.0 percent, slightly above the 92.8 percent rate for students who received neither a Pell Grant nor a subsidized loan. A completion gap that runs five to ten points at most universities is absent here. Whatever Villanova’s aid packages leave uncovered, the students who enroll finish, and they finish on time. The teaching pattern supports it: a student-faculty ratio of 9 to 1 and, in Fall 2025, only four undergraduate class sections enrolling a hundred or more students.
Beyond the numbers
Two developments frame the record. The first is demand. Applications rose 11 percent in the final year after four flat ones, which may reflect the national demographic cliff arriving unevenly or simply a strong recruiting cycle. If that increase holds while the class stays fixed, the rate will fall again and the five-year pattern described here will reverse.
The second is the growing dependence on the binding round. Filling 56 percent of a class through Early Decision, up thirteen points in four years, is a durable structural choice rather than a one-year adjustment. It stabilizes yield, and it shifts the burden onto seventeen-year-olds to commit in November, at a university where the aid offer may not cover the full gap. Those two facts sit uncomfortably together, and applicants should see them as connected rather than separate.
What the five-year record means for applicants
The overall admit rate is close to useless as a planning number, because the three rounds behind it operate on completely different terms. Binding Early Decision admitted 59.8 percent for Fall 2025. The general pool admitted 28.1 percent. And Early Action, in the one year it was broken out, admitted 15.4 percent, below the university-wide figure. Applying early at Villanova is a strategy only if the commitment is binding.
That makes the decision a financial one before it is an admissions one. A family that can absorb roughly $93,000 a year, or has run the net price calculator and can live with the likely offer, has access to the single largest statistical advantage in this entire series of reports. A family that needs to compare aid packages should apply Regular Decision with clear eyes about a 28 percent rate that is really a residual after the binding round has taken more than half the seats.
Everything else follows the transcript. Test scores are optional, submitted by barely a quarter of enrolled students, and rated only as considered, so a score should be sent only when it clears the 1420 to 1490 band. The college named on the application matters, since business, engineering, and nursing account for roughly half the degrees and internal transfer is competitive. And the outcome data, 95 percent retention, 89 percent four-year graduation, and no Pell completion gap, describe a university that does very well by the students who enroll. The harder question this file raises is not whether Villanova graduates its students. It is what they borrow to get there.