
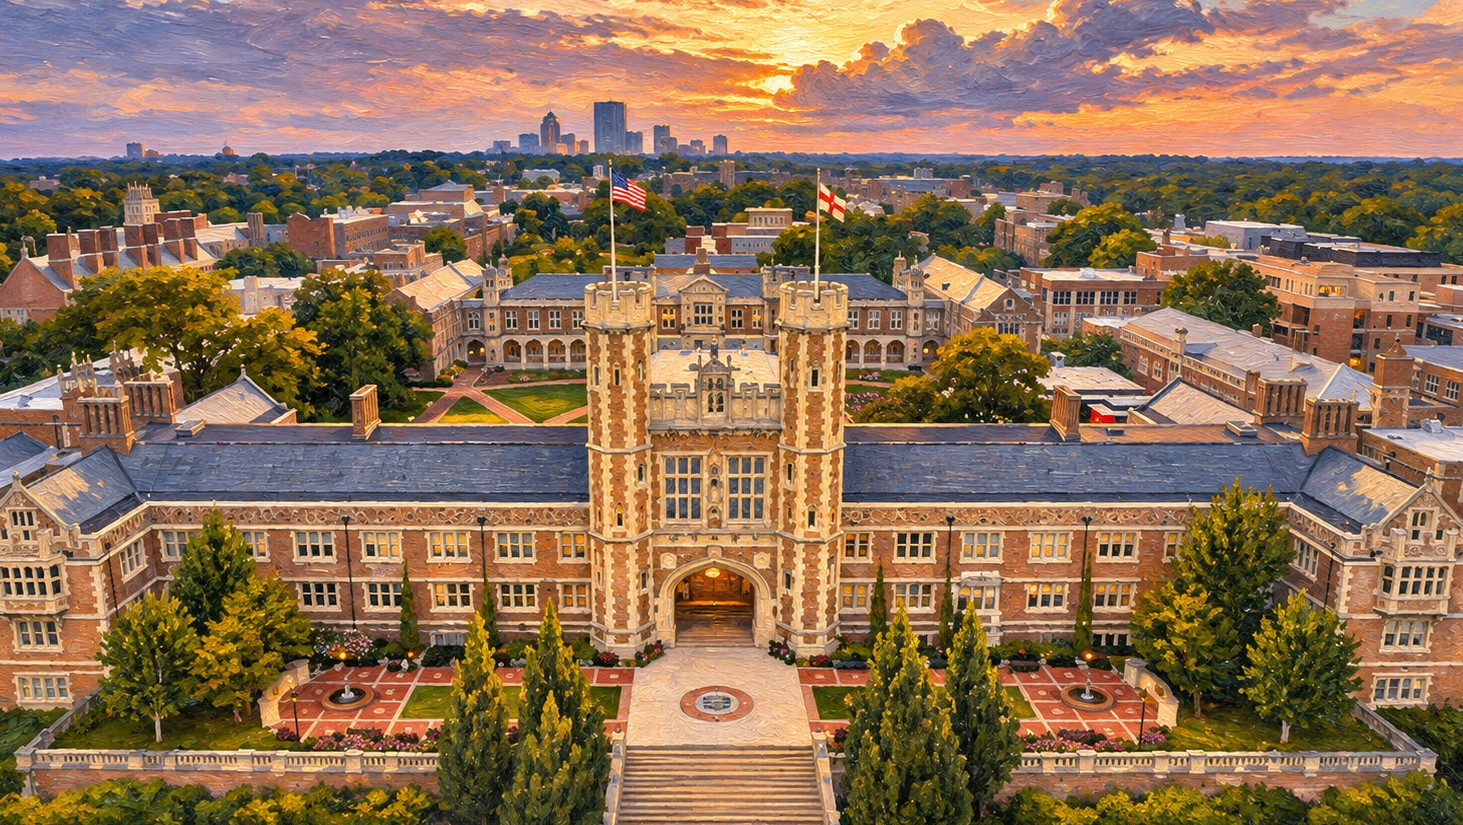
In fall 2025, 49.4 percent of the students Washington University in St. Louis admitted chose to enroll. That is the highest yield in the 11 years of federal and institutional data reviewed here, and it compares with 35.3 percent in fall 2015.
Over the same decade, WashU admitted fewer students and enrolled more of them. It admitted 3,968 first-year applicants for fall 2025, 19 percent fewer than the 4,898 it admitted for fall 2015, and enrolled 1,961 first-years, 13 percent more than the 1,731 who arrived a decade earlier. Applications rose 14 percent, to 33,283, and the admit rate fell from 16.7 percent to 11.9 percent.
The rules for the next class differ from the ones behind those numbers. For students applying to enter in fall 2027, WashU’s admissions office has added a nonbinding early action round alongside early decision I, early decision II and regular decision, has begun considering demonstrated interest, and is continuing its test-optional policy. The early action and early decision I deadline was November 2, which had passed by the time this article was published, and the early decision II and regular decision deadline is January 4. The historical figures below describe classes admitted under earlier rules.
Applicant, admit, enrollment and test-submission counts for fall 2015 through fall 2024 come from the federal IPEDS Admissions and Test Scores files for WashU (institution ID 179867). Fall 2025 figures, and the early decision, aid, cost and graduation data, come from WashU’s Common Data Set filings, including the 2025-26 edition, the latest located in this review (accessed November 17, 2026). WashU marks its aid figures in each edition as estimates for that year. All rates were computed by College Transitions from reported counts.
What the Numbers Say About Getting In
Applications ran between about 25,000 and 34,000 a year from fall 2015 to fall 2025, with a dip to 25,426 in fall 2019 and a jump to 33,634 in fall 2021, the first year WashU did not require test scores. The admit rate fell most between fall 2020 and fall 2022, from 16.0 percent to 11.8 percent, and has stayed near 12 percent since.
Figure 1. First-year applications and admit rate, fall 2015 to fall 2025. Sources: IPEDS ADM2015 to ADM2024, UNITID 179867; WashU Common Data Set 2025-26, item C1. Rates computed by College Transitions.
Fall 2022 has two applicant counts. The federal file reports 32,014 applicants, which gives the 11.8 percent admit rate shown in Figure 1. WashU’s own 2022-23 Common Data Set reports 33,214, which implies 11.3 percent. Both report 3,764 admits and 1,813 enrolled first-years. Figure 1 and Table 1 use the federal count for consistency with the rest of the series, and the early decision calculations below use the Common Data Set count.
The fall 2025 class grew for a stated reason. Grace Chapin James, an assistant vice provost at WashU, told Student Life in September 2025 that uncertainty over whether admitted international students would be able to enroll led the university to make more offers than usual. “We still wanted a typically sized class, so we made more offers of admission than typical,” she said. Student Life’s report used an early count of 1,963 first-years. The filing’s final count is 1,961, up from 1,847 in fall 2024.
WashU has also posted preliminary figures for fall 2026. Its Class of 2030 profile, which it describes as accurate as of September 21, 2026, lists 33,214 applicants, 4,057 admits and 1,941 students enrolling. By College Transitions’ calculation, that is a 12.2 percent admit rate and 47.8 percent yield. These are university figures rather than a Common Data Set filing, so the tables in this article end with fall 2025.
| Entering class | Applied | Admitted | Admit rate | Enrolled | Yield | Source |
| Fall 2015 | 29,259 | 4,898 | 16.7% | 1,731 | 35.3% | IPEDS |
| Fall 2016 | 29,197 | 4,827 | 16.5% | 1,776 | 36.8% | IPEDS |
| Fall 2017 | 30,463 | 4,863 | 16.0% | 1,778 | 36.6% | IPEDS |
| Fall 2018 | 31,320 | 4,708 | 15.0% | 1,797 | 38.2% | IPEDS, CDS |
| Fall 2019 | 25,426 | 3,522 | 13.9% | 1,732 | 49.2% | IPEDS, CDS |
| Fall 2020 | 27,949 | 4,477 | 16.0% | 1,804 | 40.3% | IPEDS, CDS |
| Fall 2021 | 33,634 | 4,373 | 13.0% | 1,980 | 45.3% | IPEDS, CDS |
| Fall 2022 | 32,014* | 3,764 | 11.8% | 1,813 | 48.2% | IPEDS |
| Fall 2023 | 32,240 | 3,855 | 12.0% | 1,828 | 47.4% | IPEDS |
| Fall 2024 | 32,754 | 3,951 | 12.1% | 1,847 | 46.7% | IPEDS, CDS |
| Fall 2025 | 33,283 | 3,968 | 11.9% | 1,961 | 49.4% | CDS |
Table 1. WashU first-year admissions, fall 2015 to fall 2025. Sources: IPEDS ADM2015 to ADM2024; WashU Common Data Set, item C1. *WashU’s CDS reports 33,214 fall 2022 applicants (11.3% admitted). Rates computed by College Transitions.
Residency rows, which the Common Data Set added in its 2023-24 edition, classify applicants by their known physical address at the time of application. Missouri applicants were admitted at a higher rate than others in all three years. For fall 2025, WashU admitted 19.3 percent of applicants from Missouri, 12.8 percent of applicants from other states and 7.3 percent of applicants with international addresses. These are pool-level rates, and the filing does not break out early decision, the WashU Pledge or academic profile by residency, so they do not measure the effect of residency on any application.
| Entering class | Residency | Applied | Admitted | Admit rate | Enrolled | Yield |
| Fall 2023 | Missouri | 1,776 | 319 | 18.0% | 218 | 68.3% |
| Fall 2023 | Other U.S. states | 23,454 | 3,121 | 13.3% | 1,381 | 44.2% |
| Fall 2023 | International | 7,010 | 415 | 5.9% | 229 | 55.2% |
| Fall 2024 | Missouri | 2,051 | 386 | 18.8% | 266 | 68.9% |
| Fall 2024 | Other U.S. states | 23,334 | 3,064 | 13.1% | 1,353 | 44.2% |
| Fall 2024 | International | 7,369 | 501 | 6.8% | 228 | 45.5% |
| Fall 2025 | Missouri | 2,017 | 390 | 19.3% | 279 | 71.5% |
| Fall 2025 | Other U.S. states | 23,436 | 3,003 | 12.8% | 1,407 | 46.9% |
| Fall 2025 | International | 7,830 | 575 | 7.3% | 275 | 47.8% |
Table 2. Admit rate and yield by residency, fall 2023 to fall 2025. Source: WashU Common Data Set 2023-24 to 2025-26, item C1, based on known physical address at application. Rates computed by College Transitions.
For Students Considering Early Decision
WashU’s early decision applications, which the filing reports as one number covering both rounds, rose from 1,840 for fall 2018 to 4,934 for fall 2025. The latest increase was smaller, 2.4 percent over fall 2024’s 4,817. Early decision admits rose from 772 to 1,333 over the full period.
Figure 2. Early decision admit rate and a residual estimate for all other applicants, fall 2018 to fall 2025. Source: WashU Common Data Set, items C1 and C21, with same-edition denominators. Residual estimates computed by College Transitions.
For fall 2025, WashU admitted 27.0 percent of early decision applicants. Subtracting those counts from the totals leaves 28,349 other applicants and 2,635 admits, a residual estimate of 9.3 percent. That figure is arithmetic, not a regular decision rate WashU reports. Its denominator excludes all early decision applications, while its numerator subtracts only students admitted under early decision, so later offers to deferred early applicants can affect it. The gap between the two rates describes two pools with different compositions and does not measure how much applying early helps any one student.
The Common Data Set does not report how many early decision admits enrolled. WashU’s admissions site says that about 60 percent of its class is admitted through an early decision round, without naming a specific class. In August 2026, James called early decision “the ultimate signal” of a student’s interest, and Vice Provost Ronné Turner said the university did not yet know how the new early action round would change application patterns.
| Entering class | ED applicants | ED admits | ED rate | Residual estimate, all other applicants |
| Fall 2018 | 1,840 | 772 | 42.0% | 13.4% |
| Fall 2019 | 3,066 | 1,042 | 34.0% | 11.1% |
| Fall 2020 | 3,109 | 1,080 | 34.7% | 13.7% |
| Fall 2021 | 3,754 | 1,098 | 29.2% | 11.0% |
| Fall 2022 | 4,175 | 1,092 | 26.2% | 9.2% |
| Fall 2023 | 4,517 | 1,158 | 25.6% | 9.7% |
| Fall 2024 | 4,817 | 1,217 | 25.3% | 9.8% |
| Fall 2025 | 4,934 | 1,333 | 27.0% | 9.3% |
Table 3. Early decision and all other applicants, fall 2018 to fall 2025. Source: WashU Common Data Set, items C1 and C21. Fall 2022 uses the CDS applicant count of 33,214. The residual estimate is (total admits minus ED admits) / (total applicants minus ED applicants), computed by College Transitions.
The waitlist offers a smaller opening. For fall 2025, 3,865 students accepted a place on WashU’s waitlist and 327 were admitted from it, about 8.5 percent of those who accepted a spot. WashU reports that the list is not ranked and leaves blank the number of students offered a place, so the share of all waitlist offers that ended in admission cannot be calculated.
For Students Deciding Whether to Send Scores
Submission patterns since WashU went test-optional, with the class that entered in fall 2021, have changed more for the ACT than for the SAT. In fall 2017, 81 percent of enrolled first-years had submitted an ACT score. By fall 2025 the figure was 29 percent, close to the 32 percent who submitted an SAT. Students can send both tests, so the shares overlap and cannot be added.
Figure 3. Share of enrolled first-years who submitted SAT and ACT scores, fall 2015 to fall 2025. Sources: IPEDS ADM2015 to ADM2024; WashU Common Data Set 2025-26, item C9.
Among fall 2025 submitters, the middle half scored 1500 to 1550 on the SAT, with a median of 1530, and 33 to 35 on the ACT. For fall 2026, WashU’s class profile reports that 63 percent of applicants and 63 percent of enrolling students submitted test scores, with middle ranges of 1510 to 1550 on the SAT and 33 to 35 on the ACT. In August 2026, Turner attributed the rise in part to peer schools reinstating requirements. “As more of our peers require test scores, students have become accustomed to sharing scores,” she said, adding that she expected an announcement on WashU’s own policy within the year.
The 2025-26 filing rates standardized test scores as “very important,” alongside rigor of the secondary school record, class rank, academic GPA, the application essay and recommendations. That rating describes how scores are weighed and does not make them required. Level of applicant’s interest, state residency, geographic residence and alumni relations are rated “considered.” The filing leaves its GPA fields blank, and of the 27 percent of enrolled first-years who submitted a class rank, 86 percent ranked in the top tenth. The submitter score ranges are context, not cutoffs, and whether a score adds useful evidence depends on the student’s school, preparation opportunities and record.
For Families Estimating Cost
WashU’s 2025-26 filing lists estimated 2026-27 first-year charges of $71,310 in tuition, $1,412 in required fees and $24,272 for on-campus food and housing, a total of $96,994, up 4.4 percent from $92,932 for 2025-26. With the filing’s estimates for books ($1,412), transportation ($1,050) and other expenses ($2,804), the first-year budget is $102,260. WashU’s student health insurance premium of $2,923 for 2026-27 is billed separately to students who do not waive it with comparable coverage, which would bring the illustrative budget to $105,183. Families can get a personalized estimate from the net price calculator on WashU’s financial aid site.
Figure 4. Average need-based scholarship or grant for first-time, full-time first-years who received one, fall 2018 to fall 2025, in current dollars. Source: WashU Common Data Set, item H2; each edition reports estimates.
The average need-based grant for first-years who received one rose from $48,522 for fall 2018 to an estimated $75,880 for fall 2025, an increase of 56 percent before inflation. In fall 2025, 946 first-years applied for need-based aid, 843 were found to have need, or 43.0 percent of the class, and WashU reports need fully met for all 843. The average total package for students with need was $81,871. The filing also reports that 252 first-years with need received non-need scholarship or grant aid, and that 44 first-years without demonstrated need received institutional non-need grants averaging $36,250.
Three policies shape those figures. WashU’s admissions for first-year domestic applicants are need-blind, under an initiative announced in fall 2021, and the university says it meets 100 percent of demonstrated need. WashU announced in September 2023 that, starting in fall 2024, it would replace federal loans in undergraduate aid packages with grants and scholarships. The WashU Pledge covers tuition, fees, housing and food for admitted full-time first-years who are U.S. citizens or permanent residents, who live or attend high school in Missouri or one of 53 designated Illinois counties, and whose families earn $75,000 or less, and it is guaranteed for four years. WashU reports that 5 percent of the Class of 2030 is Pledge-eligible.
Of the 1,889 bachelor’s recipients in the class of 2025 who entered WashU as first-time students, 346, or 18 percent, borrowed through any loan program, with an average cumulative principal of $22,127 among borrowers. The total covers borrowing over each student’s enrollment and includes private loans, and the data cannot isolate the effect of the fall 2024 policy. The share for the class of 2024 was 22 percent.
| Fall 2025 first-years (2025-26 estimates) | Count or amount |
| First-time, full-time first-years (line A) | 1,961 |
| Applied for need-based aid | 946 |
| Found to have financial need | 843 (43.0%) |
| Received a need-based scholarship or grant | 836 |
| Average need-based scholarship or grant | $75,880 |
| Average aid package, students with need | $81,871 |
| Students with need whose need was fully met | 843 of 843 |
| Students with need who also received non-need scholarship or grant aid | 252 |
| Students without need who received institutional non-need grants | 44 (average $36,250) |
| Athletic scholarships | 0 |
Table 4. First-year financial aid, fall 2025. Source: WashU Common Data Set 2025-26, items H2 and H2A, marked as 2025-26 estimates.
For Counselors Reading the Class Profile
The yield trend in Figure 5 has two breaks. It jumped to 49.2 percent in fall 2019, the year applications fell to 25,426, and dipped to 40.3 percent in fall 2020, the first pandemic fall. From fall 2021 through fall 2025 it stayed between 45 and 50 percent. WashU’s preliminary fall 2026 figures put it at 47.8 percent.
Figure 5. Yield, fall 2015 to fall 2025, with the preliminary fall 2026 figure from the September 21, 2026 class profile. Sources: IPEDS ADM2015 to ADM2024; WashU Common Data Set 2025-26, item C1; WashU Class of 2030 profile. Yield computed by College Transitions.
WashU reports that 23 percent of its fall 2025 and fall 2026 first-years were Pell-eligible, and Student Life reported a figure of 25 percent for fall 2024. In 2022 the university described its fall 2022 class, at 20 percent, as a 15-percentage-point increase over a decade earlier. Those are figures on Pell eligibility. The Common Data Set’s graduation tables count Pell recipients in the adjusted entering cohort. In the fall 2019 cohort, 246 of 264 Pell recipients graduated within six years, 93.2 percent, compared with 1,598 of 1,723 students overall, 92.7 percent.
| Entering cohort | Pell recipients | Subsidized Stafford, no Pell | Neither | All students |
| Fall 2018 | 91.8% (235 of 256) | 94.5% (205 of 217) | 94.7% (1,235 of 1,304) | 94.3% (1,675 of 1,777) |
| Fall 2019 | 93.2% (246 of 264) | 92.5% (246 of 266) | 92.7% (1,106 of 1,193) | 92.7% (1,598 of 1,723) |
Table 5. Six-year graduation rates by Pell and Stafford status, fall 2018 and fall 2019 cohorts. Source: WashU Common Data Set 2025-26, graduation rate tables. Rates computed by College Transitions from reported counts.
By race and ethnicity, the fall 2025 class was 38.1 percent white, non-Hispanic, 21.8 percent Asian, non-Hispanic, 11.3 percent Hispanic/Latino, 7.2 percent Black or African American, non-Hispanic, and 12.0 percent nonresident. The nonresident category follows federal reporting definitions, which is why it counts 235 students while the residency table counts 275 enrolled students with international addresses.
| Group | Fall 2025 first-years | Share |
| Nonresidents | 235 | 12.0% |
| Hispanic/Latino | 221 | 11.3% |
| Black or African American, non-Hispanic | 142 | 7.2% |
| White, non-Hispanic | 748 | 38.1% |
| American Indian or Alaska Native, non-Hispanic | 3 | 0.2% |
| Asian, non-Hispanic | 428 | 21.8% |
| Native Hawaiian or Other Pacific Islander, non-Hispanic | 2 | 0.1% |
| Two or more races, non-Hispanic | 121 | 6.2% |
| Race and/or ethnicity unknown | 61 | 3.1% |
| Total | 1,961 |
Table 6. Racial and ethnic composition of degree-seeking first-years, fall 2025. Source: WashU Common Data Set 2025-26, item B2. Shares computed by College Transitions; rounded shares may not sum to 100 percent.
Of the 1,842 students in the fall 2024 retention cohort of first-time, full-time bachelor’s degree seekers, 1,747 returned for fall 2025, a retention rate of 94.8 percent, which the filing reports as 95 percent. Among bachelor’s degrees conferred between July 1, 2024, and June 30, 2025, engineering accounted for 14 percent, biological/life sciences and the social sciences for 13 percent each, business/marketing for 10 percent, and computer and information sciences and interdisciplinary studies for 9 percent each. WashU reports a 10-to-1 student-to-faculty ratio, and 1,244 of its 1,892 fall 2025 class sections, or 65.8 percent, enrolled fewer than 20 students.
What These Figures Cannot Tell You
The filings show how many students applied, were admitted and enrolled, and what aid the average recipient received. Several questions a family will want answered before choosing a round or a school sit outside them. Table 7 pairs each with what the public data show and what to ask WashU directly.
| Question | What the public data show | What to ask WashU |
| Does early decision raise a student’s chances? | Fall 2025 ED admit rate 27.0%; residual estimate for all other applicants 9.3%; the pools differ | How do the academic profiles of the ED and regular pools compare? |
| How much of the class enters through ED? | WashU’s admissions site says about 60% of the class is admitted through an ED round; the CDS does not report ED enrollment | How many fall 2025 ED admits enrolled? |
| How often does the waitlist lead to admission? | 3,865 accepted a fall 2025 waitlist spot and 327 were admitted from it; the number offered a spot is blank | How many students were offered a spot, and does admission from the waitlist vary by year? |
| Will sending scores help? | Test-optional for fall 2027; the 2025-26 CDS rates test scores very important, which does not make them required; 63% of fall 2026 enrollees submitted scores | Will the policy continue beyond fall 2027? |
| How does demonstrated interest count? | Rated considered in the 2025-26 CDS; WashU began considering it for fall 2027 applicants | Which forms of engagement does WashU record? |
| What will a family pay? | 2026-27 estimated budget $102,260 before aid, plus $2,923 insurance unless waived; average need-based grant $75,880 (estimated) | What does the net price calculator show for this family? |
Table 7. Questions the public data cannot settle. Sources: WashU Common Data Set 2025-26; WashU fall 2027 admissions updates; WashU Class of 2030 profile; WashU Student Health Center.
Sources
Washington University in St. Louis, Common Data Set 2025-26. https://washu.edu/app/uploads/2026/06/2025-2026-WashU-CDS.pdf
Washington University in St. Louis, Common Data Set 2024-25. https://washu.edu/app/uploads/2025/06/2024-2025-WashU-CDS.pdf
Washington University in St. Louis, Common Data Set 2018-19 (2019-20 to 2021-22 at the same address pattern). https://washu.edu/app/uploads/2024/06/wustl-cds-2018-2019.pdf
NCES, IPEDS Admissions and Test Scores survey files ADM2015 to ADM2024, UNITID 179867 (via College Transitions IPEDS panel). https://nces.ed.gov/ipeds/datacenter/DataFiles.aspx
WashU Admissions, Important updates for fall 2027. https://admissions.washu.edu/whats-new-at-washu/
WashU Admissions, Class of 2030 Profile (as of Sept. 21, 2026). https://admissions.washu.edu/life-at-washu/our-students/
The Source, WashU admissions strategy is working and evolving, Aug. 27, 2026. https://source.washu.edu/2026/08/washu-admissions-strategy-is-working-and-evolving/
Student Life, WashU’s Class of 2029 grows amid shifting admissions landscape, Sept. 3, 2025. https://www.studlife.com/news/2025/09/03/washus-class-of-2029-grows-amid-shifting-admissions-landscape
The Source, WashU hits major milestone, Aug. 17, 2022. https://source.washu.edu/2022/08/washu-hits-major-milestone-class-of-2026-is-20-pell-grant-eligible-15-first-generation/
The Source, Tuition-related frequently asked questions, March 17, 2026. https://source.washu.edu/2026/03/tuition-related-frequently-asked-questions-10/
Student Life, University announces new no-loan policy, Sept. 13, 2023. https://www.studlife.com/news/2023/09/13/university-announces-new-no-loan-policy-will-be-implemented-next-fall
WashU Financial Aid, WashU Pledge. https://financialaid.washu.edu/how-washu-helps/washu-pledge/
WashU Student Health Center, Student health insurance. https://studenthealthcenter.washu.edu/about/student-health-insurance/

