

William & Mary reports an admit rate near 34 percent, a number that places it among solid public universities rather than the most selective ones. For most of the students who apply, that number is close to meaningless. William & Mary runs its admissions the way a selective private does, and two features of the process settle far more than the headline rate suggests: a binding early round that fills close to half the class, and a state framework that reserves most seats for Virginians.
Everything here comes from William & Mary’s own Common Data Set submissions for the 2021-2022 through 2025-2026 cycles, supplemented where noted by public reporting the data set does not carry. William & Mary is small for a public, with about 6,900 undergraduates, and it behaves less like a large flagship than like a highly selective liberal arts college that happens to be state-supported.
That identity is not an accident of size. Chartered in 1693, William & Mary is the second-oldest college in the country, and it has spent the modern era positioning itself as a public alternative to the small private colleges of the Northeast rather than as a research behemoth. The scale is deliberate, the curriculum is broad, and the admissions operation is built to shape a class rather than to process a flood of applications. Reading the five-year record with that in mind explains most of what follows, including why the numbers move so little from year to year.
A pool that is not growing
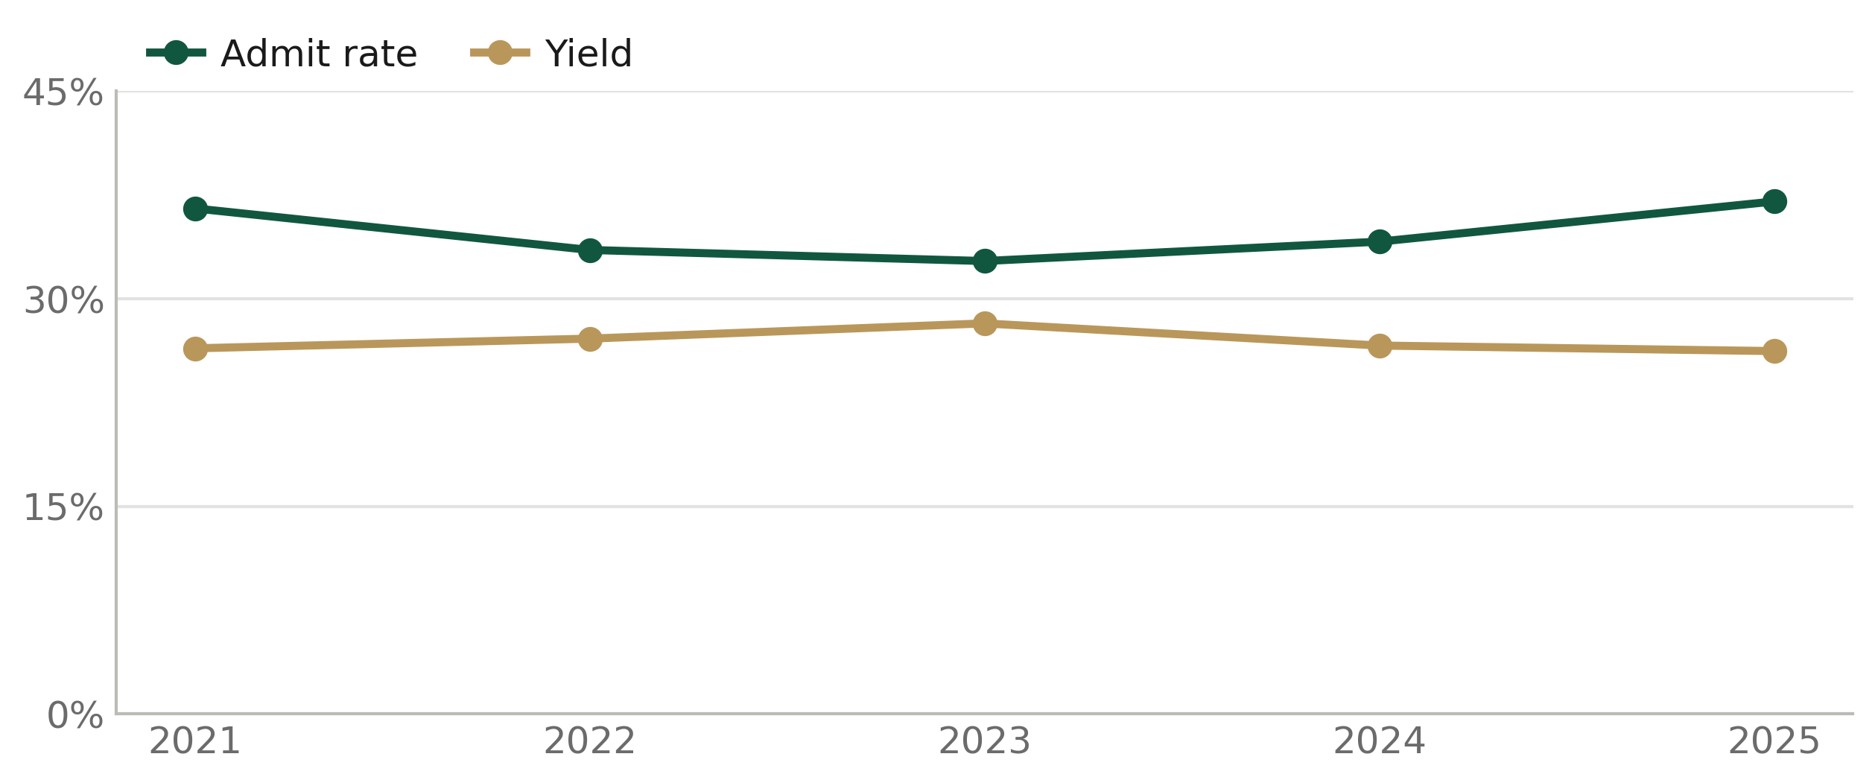
The story at many flagships over these five years was a surging applicant pool. William & Mary is the counterexample. Applications ran 17,475 for Fall 2021, peaked at 18,087 for Fall 2022, and settled at 16,895 for Fall 2025, slightly below where they started. The entering class held steady near 1,620 to 1,680. Admit rates stayed in a narrow band between 33 and 37 percent.
| 2021-22 | 2022-23 | 2023-24 | 2024-25 | 2025-26 | |
| Entering class | Fall 2021 | Fall 2022 | Fall 2023 | Fall 2024 | Fall 2025 |
| Applications | 17,475 | 18,087 | 17,548 | 17,798 | 16,895 |
| Admitted | 6,386 | 6,059 | 5,741 | 6,064 | 6,245 |
| Admit rate | 36.5% | 33.5% | 32.7% | 34.1% | 37.0% |
| Enrolled | 1,684 | 1,642 | 1,619 | 1,614 | 1,639 |
| Yield | 26.4% | 27.1% | 28.2% | 26.6% | 26.2% |
| First-year retention | 93% | 95% | 94.6% | 95% | 95.3% |
Source: William & Mary Common Data Set filings, sections C1 and B22.
Applications and offers of admission, Fall 2021 to Fall 2025. Source: William & Mary Common Data Set filings.
A flat pool is a choice as much as a circumstance. William & Mary did not chase volume through the test-optional era, and its yield, the share of admitted students who enroll, sat around 26 to 28 percent, low enough that the college has to admit roughly four students for every seat it fills. The pattern describes an institution competing for cross-admits against private liberal arts colleges and other public honors options, not one riding an application boom.

Admit rate and yield, Fall 2021 to Fall 2025. Source: William & Mary Common Data Set filings.
The binding round does the work
William & Mary runs two binding early decision rounds, the first closing November 1 and the second January 5. Early applications climbed from 1,184 for Fall 2021 to 1,586 for Fall 2024 before easing to 1,477 for Fall 2025, and early admits rose from 581 to 746 before easing to 735 across the same window. An early applicant was admitted at close to 47 percent, against the 34 percent that the full pool faced.
| Early decision | 2021-22 | 2022-23 | 2023-24 | 2024-25 | 2025-26 |
| ED applications | 1,184 | 1,247 | 1,460 | 1,586 | 1,477 |
| ED admitted | 581 | 620 | 664 | 746 | 735 |
| ED admit rate | 49.1% | 49.7% | 45.5% | 47.0% | 49.8% |
Source: William & Mary Common Data Set filings, section C21. The 2024-25 filing reports the two ED rounds combined; the admit count is drawn from public William & Mary reporting for that class.
Early decision applications and admits, Fall 2021 to Fall 2025. Source: William & Mary Common Data Set filings and William & Mary admissions reporting.
The consequence sits in the regular round. If binding early admits number around 735 and nearly all of them enroll, as a binding commitment requires, then close to 45 percent of a 1,630-student class is settled before the regular pool is read. A regular-round applicant is competing for the remaining seats at odds well below the published rate. For a student who is certain about William & Mary, the early commitment is the single largest lever available, and the numbers show a growing share of applicants pulling it.
There is a cost to that lever, and it falls unevenly. A binding commitment locks a family into whatever aid package arrives, with no chance to compare offers from other colleges in the spring. For a student who can pay the full nonresident price, that is a small price for a large advantage. For a family that needs to weigh financial aid awards against one another, applying early means surrendering exactly that bargaining power, and at a college that meets only part of demonstrated need, the tradeoff is not trivial. The early round therefore tends to reward applicants who are both certain and less price-sensitive, which is worth naming plainly rather than treating the 47 percent rate as a free boost available to everyone.
The Virginia math
William & Mary is a public university of the Commonwealth of Virginia, and its class reflects that. The entering cohort runs roughly 61 percent Virginia residents and 39 percent from other states and countries, a balance shaped by the long-standing expectation that a Virginia public serves Virginians first. In-state and out-of-state applicants were admitted at nearly the same rate for the most recent classes, close to 34 percent, which is unusual among state universities and means the out-of-state pool competes hard for a minority of the seats.
Price rides on that residency line, and the gap is one of the widest in public higher education. Out-of-state tuition reached $46,177 for 2026-27, against $19,734 in-state. With required fees and housing, the out-of-state cost of attendance approaches $71,000, roughly $26,000 more than a Virginian pays for the same degree.
The residency framework changes how an out-of-state applicant should read every other number in this report. When 61 percent of the class is set aside for Virginians, the roughly 6,600 nonresident applicants are effectively competing for a few hundred seats, and the equal in-state and out-of-state admit rates mask that pressure rather than relieve it. A non-Virginian who is serious about William & Mary is looking at a truly selective private-college admit picture wrapped in a public-university sticker rate, and the binding early round is the main way to improve those odds. None of this makes the college a poor choice for an out-of-state student; it makes the decision one that rewards early clarity and careful cost planning.
Test-optional, made permanent
William & Mary tested a test-optional policy during the pandemic, judged the pilot a success, and made the policy permanent rather than renewing it year by year. Under it, the share of enrolled students submitting an SAT score moved from 51 percent for Fall 2021 to 43 percent for Fall 2024 and back to 48 percent for Fall 2025, while ACT submission fell steadily toward 14 percent. About three in five students submit some test.
| 2021-22 | 2022-23 | 2023-24 | 2024-25 | 2025-26 | |
| Submitted SAT | 51% | 52% | 45% | 43% | 48% |
| Submitted ACT | 19% | 18% | 17% | 16% | 14% |
| SAT composite, 25th-75th | 1360-1520 | 1375-1520 | 1365-1510 | 1400-1530 | 1390-1520 |
| SAT composite median | n/a | 1460 | 1450 | 1470 | 1450 |
| ACT composite, 25th-75th | 31-34 | 32-34 | 32-34 | 32-34 | 32-34 |
| Average GPA (weighted) | 4.30 | 4.33 | 4.37 | 4.36 | 4.34 |
| Top tenth of class | 81.6% | 77.0% | 75.4% | 73.6% | 78.7% |
Source: William & Mary Common Data Set filings, sections C9, C10, and C12. A composite median was not reported for Fall 2021.
Share of enrolled first-year students submitting scores. Source: William & Mary Common Data Set filings.
Among the students who do submit, the scores are high and stable. The middle 50 percent of SAT composites held near 1360 to 1520 across all five years, with the median drifting up toward 1450 to 1470, and the ACT band stayed at 32 to 34. This is the ordinary arithmetic of a test-optional policy: strong scorers keep submitting, others hold back, and the reported range sits well above what the full class would show. A submitted score near or above the middle of that band helps; a score below it is a reason to apply without one.

SAT composite, middle 50 percent of submitters. Source: William & Mary Common Data Set filings.
What the college weighs instead of scores is spelled out in its own filing, and it is a long list. William & Mary marks rigor of the secondary school record, class rank, grade-point average, recommendations, the application essay, extracurricular activities, talent, character, and state residency all as very important, and it reads each application at least twice, once by the regional dean. That breadth is the substance behind the word holistic, and it means a strong transcript and a distinctive application carry an admission further than a test score does. The average weighted grade-point average of enrolled students held at 4.3 or above every year, and roughly three-quarters graduated in the top tenth of their high school class, so the academic floor is high even where the test is absent.
Who enrolls
William & Mary’s entering class is majority white, and that share grew over the period, from about 60 percent for Fall 2021 to nearly 64 percent for Fall 2025. Asian enrollment eased from roughly 12 to 11 percent, Hispanic enrollment held near 9 to 10 percent, and students of two or more races rose from 6 to about 8 percent. Two movements stand out. Black enrollment dropped to 4.2 percent for Fall 2024, the first class admitted after the 2023 Supreme Court decision on race-conscious admission, before recovering to 4.7 percent. International enrollment fell by half, from 4.0 to 2.1 percent.
| First-year students | Fall 2021 | Fall 2022 | Fall 2023 | Fall 2024 | Fall 2025 |
| White | 1,014 (60.2%) | 995 (60.6%) | 972 (60.0%) | 1,031 (63.9%) | 1,046 (63.8%) |
| Asian | 199 (11.8%) | 194 (11.8%) | 195 (12.0%) | 173 (10.7%) | 173 (10.6%) |
| Hispanic or Latino | 155 (9.2%) | 156 (9.5%) | 160 (9.9%) | 142 (8.8%) | 155 (9.5%) |
| Two or more races | 105 (6.2%) | 115 (7.0%) | 112 (6.9%) | 133 (8.2%) | 128 (7.8%) |
| Black or African American | 96 (5.7%) | 89 (5.4%) | 89 (5.5%) | 68 (4.2%) | 77 (4.7%) |
| International | 68 (4.0%) | 65 (4.0%) | 62 (3.8%) | 40 (2.5%) | 35 (2.1%) |
| Race/ethnicity unknown | 44 (2.6%) | 26 (1.6%) | 28 (1.7%) | 21 (1.3%) | 24 (1.5%) |
Source: William & Mary Common Data Set filings, section B2, first-time first-year students. American Indian and Pacific Islander categories, each under one percent, are omitted here.

First-year class composition, Fall 2021 versus Fall 2025. Source: William & Mary Common Data Set filings.
The two shifts have different causes. The change in the Black and white shares tracks the timing of the 2023 ruling closely enough that it belongs in any honest reading of the data, though a single college’s year-to-year counts are small and move for many reasons at once. The international decline is a separate matter, driven by visa friction and a smaller nonresident footprint overall, and it compounds the residency math already described. Set against the deliberate stability of almost everything else in these filings, the demographic lines are among the few that actually moved.
What students study
The academic center of gravity at William & Mary is the social sciences, which produced about 20 percent of bachelor’s degrees every year, a reflection of the college’s long strength in government, economics, and international relations and its heavy pre-law pipeline. Business, through the Raymond A. Mason School, accounted for roughly 10 to 12 percent, biology for 10 to 12 percent, and psychology for 8 to 9 percent. History, at about 6 percent, is unusually large for a public university and speaks to the college’s liberal arts identity.

Bachelor’s degrees conferred by field, share of all degrees. Source: William & Mary Common Data Set filings.
| Bachelor’s degrees | 2021-22 | 2022-23 | 2023-24 | 2024-25 | 2025-26 |
| Social sciences | 21.8% | 19.6% | 23.2% | 20.1% | 19.9% |
| Business / marketing | 9.6% | 11.8% | 10.0% | 9.8% | 10.9% |
| Biological sciences | 11.2% | 11.3% | 10.3% | 12.5% | 9.7% |
| Psychology | 8.3% | 7.8% | 9.1% | 7.6% | 8.7% |
| Computer & information sciences | 3.9% | 4.6% | 4.8% | 4.9% | 6.5% |
| History | 5.7% | 4.9% | 5.7% | 6.3% | 6.5% |
Source: William & Mary Common Data Set filings, section J. Degrees conferred lag admission by roughly four years.
The dominance of the social sciences is the academic fact that most distinguishes William & Mary from a typical public. Government is among the largest majors on campus, feeding one of the strongest per-capita pipelines to law school and public service in the country, and economics and international relations sit alongside it. A student choosing William & Mary is, more often than at a comparably ranked public, choosing a liberal arts education with a pre-professional edge rather than a direct-to-industry track.
The clearest movement is computer science, which grew from 3.9 percent of degrees to 6.5 percent, a two-thirds increase, and is almost certainly understated by the four-year lag between admission and graduation. William & Mary is building around that demand. In 2025 the university opened a new School of Computing, Data Sciences, and Physics, its first new school in decades, a bet that the fields already climbing in the degree data will climb further. For applicants, the practical read is that computing and data science are the areas where William & Mary is adding capacity fastest, and that the college is trying to graft a technical school onto a liberal arts core rather than replace one with the other.
Price, aid, and what it costs to attend
Out-of-state tuition rose from $40,089 for 2022-23 to $46,177 for 2026-27, a 15 percent climb that keeps William & Mary among the most expensive public universities in the country for nonresidents. In-state tuition rose more gently, from $17,434 to $19,734. The nonresident premium, the extra a family pays for an out-of-state seat, now exceeds $26,000 a year in tuition alone.

Published tuition, in-state versus out-of-state. Source: William & Mary Common Data Set filings.
On aid, William & Mary does not promise to meet full need, a line that separates it from the wealthiest privates it competes against. The average share of demonstrated need met for first-year students sat between 79 and 83 percent across the period, and the average need-based grant rose from about $19,500 to $22,900. The college’s borrowers finish with relatively modest debt by national standards, but the combination of a high nonresident price and partial need coverage means an out-of-state family should model the four-year cost carefully before committing.
| Cost and aid | 2021-22 | 2022-23 | 2023-24 | 2024-25 | 2025-26 |
| In-state tuition | $17,434 | $18,253 | $18,709 | $19,178 | $19,734 |
| Out-of-state tuition | $40,089 | $42,053 | $43,442 | $44,876 | $46,177 |
| Average need met, first-year | 83% | 82% | 79% | 82% | 82% |
| Average need-based grant | $19,533 | $20,857 | $19,667 | $21,820 | $22,933 |
Source: William & Mary Common Data Set filings, sections G1 and H2. Tuition figures are the following year’s published rates reported in each filing.
Average need-based grant to first-year aid recipients. Source: William & Mary Common Data Set filings.
Staying and finishing
Once enrolled, William & Mary students stay and graduate at rates near the top for any public university. First-year retention held between 93 and 95 percent, rising across the period. The six-year graduation rate ran a steady 91 percent for the cohorts that entered before the pandemic, then slipped to 89.4 percent for the 2018 entering cohort and 88.3 percent for the 2019 cohort, the classes whose middle years were disrupted by COVID-19. The dip is real and worth watching, though the level remains high.
Undergraduate enrollment grew from 6,543 in Fall 2021 to 7,063 in Fall 2024 before easing to 6,951 in Fall 2025. The institution is not expanding the way a growth-minded flagship would; it is holding a deliberately small scale, which is part of what a William & Mary degree is understood to buy.
What the five-year record means for applicants
For a Virginia resident, William & Mary is one of the strongest values in American public higher education, and the roughly one-in-three admit rate is a realistic target for a strong student. For an out-of-state applicant, the picture is harder in two directions at once: the regular round is far tougher than 34 percent once the binding early commitments are subtracted, and the price is high with only partial need coverage. The early decision round is the clearest lever, roughly doubling the odds for a student willing to commit, and it is where a growing share of the class is now decided.
Test scores are optional and will stay that way, but the students who submit cluster near 1450 on the SAT, so a score below the middle of that band is better left off. The academic bet the college is making is visible in the degree data and in the new computing school, and an applicant drawn to data science or computer science is arriving as William & Mary pours resources into exactly those fields. The number that opens this report, 34 percent, is the one figure least worth planning around.

